


Every options education resource starts the same way: here is the options chain, here are the columns, now you know how to trade. It is the equivalent of handing someone a cockpit instrument panel and telling them they can fly. Knowing how to read options chain data is not the same as knowing what it means — and most traders never get past the column definitions.
The options chain is a real-time snapshot of the market’s pricing, positioning, and liquidity for every strike and expiration on a given underlying. It tells you what the market thinks. It tells you where the action is. It tells you where liquidity exists and where it does not. What it does not tell you is why — and that is where most traders stall out. They can read the numbers. They cannot read the structure behind them.
This guide covers how to read an options chain properly, what each column actually reveals, and where the chain’s usefulness ends and structural analysis begins.
What an Options Chain Is — And What It Is Not
An options chain is a table displaying all available option contracts for a given underlying asset. It is organized by expiration date and strike price. Calls are typically on the left. Puts are on the right. Each row represents a strike price. Each column shows a data point — bid, ask, last price, volume, open interest, implied volatility, and the Greeks.
The chain is not a trading signal. It is not a strategy. It is an information display. The same way a scoreboard tells you the score but not the game plan, the options chain tells you current pricing but not what to do with it. Most traders treat the chain as the end point of their analysis. It is the starting point.
Every broker platform displays the chain slightly differently, but the data is the same. If you can read one, you can read all of them. The differences are cosmetic. The information is standardized through the Options Clearing Corporation and the exchanges.
How to Read the Options Chain: Columns That Actually Matter
Most tutorials walk through every column as though they are equally important. They are not. Some columns are critical. Others are noise for retail traders. Here is what matters when you read the options chain for any underlying.
Bid and Ask. The bid is the highest price someone is willing to pay for the contract. The ask is the lowest price someone is willing to sell it for. The difference — the spread — is your immediate cost of entry. A $0.05 spread on an SPX option is tight. A $0.50 spread on a low-volume stock option means you are giving up edge before the trade even starts. Tight spreads mean liquidity. Wide spreads mean you are trading in the dark.
Last Price. The last executed trade price. This is often stale — especially on illiquid contracts where the last trade might have been hours or days ago. Never use last price as your entry target. Use the bid-ask midpoint instead.
Volume. The number of contracts traded today. High volume at a specific strike tells you that traders are active there right now. But volume alone does not tell you whether those were opening or closing trades, or whether they were buys or sells. That requires order flow analysis — a level deeper than the chain displays.
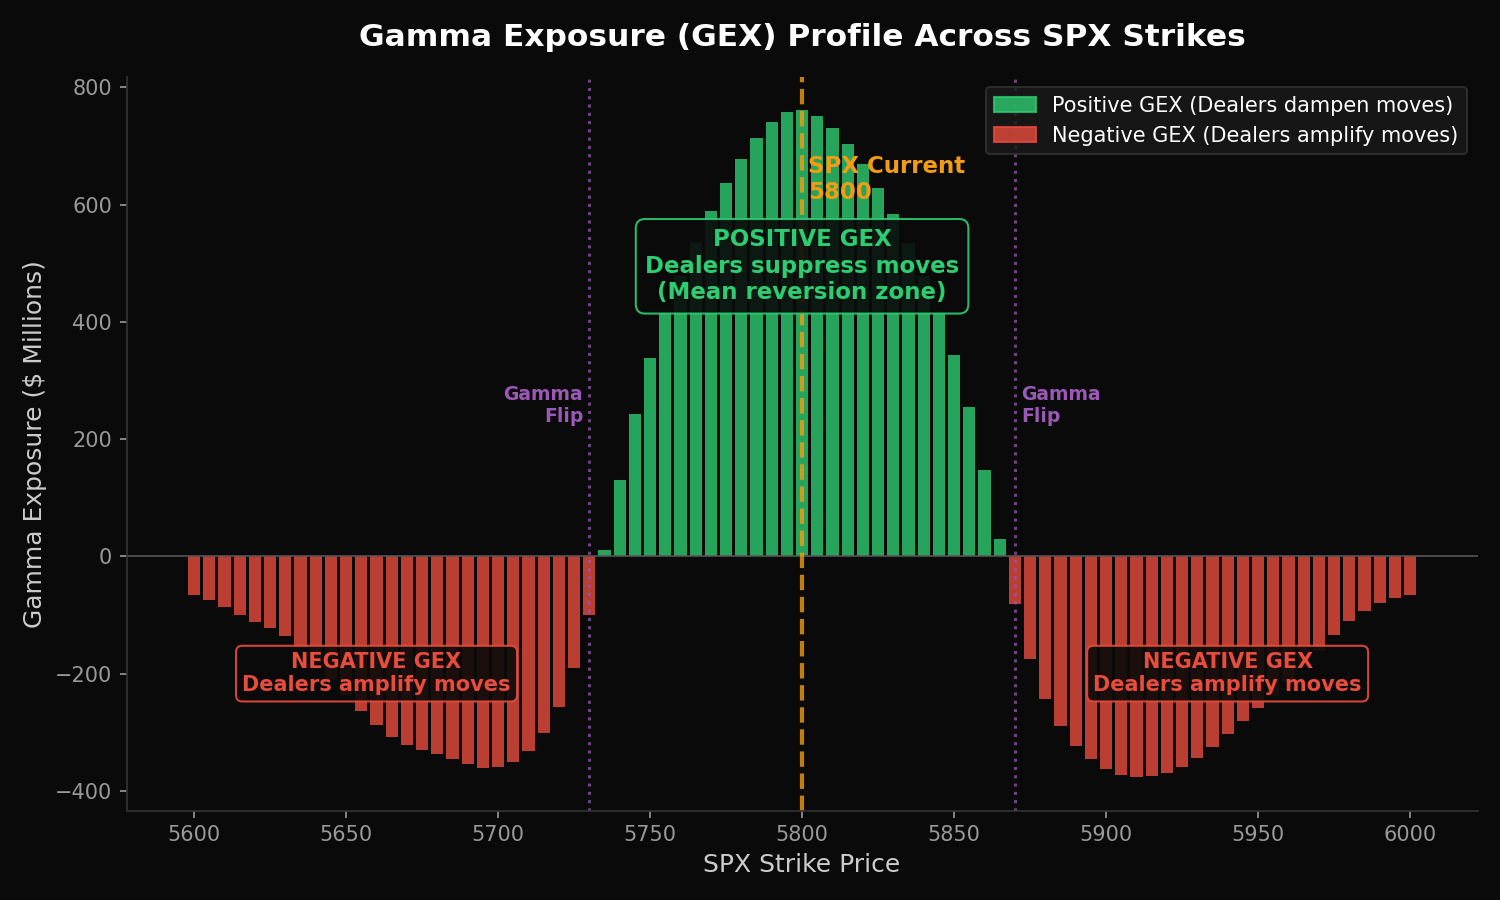
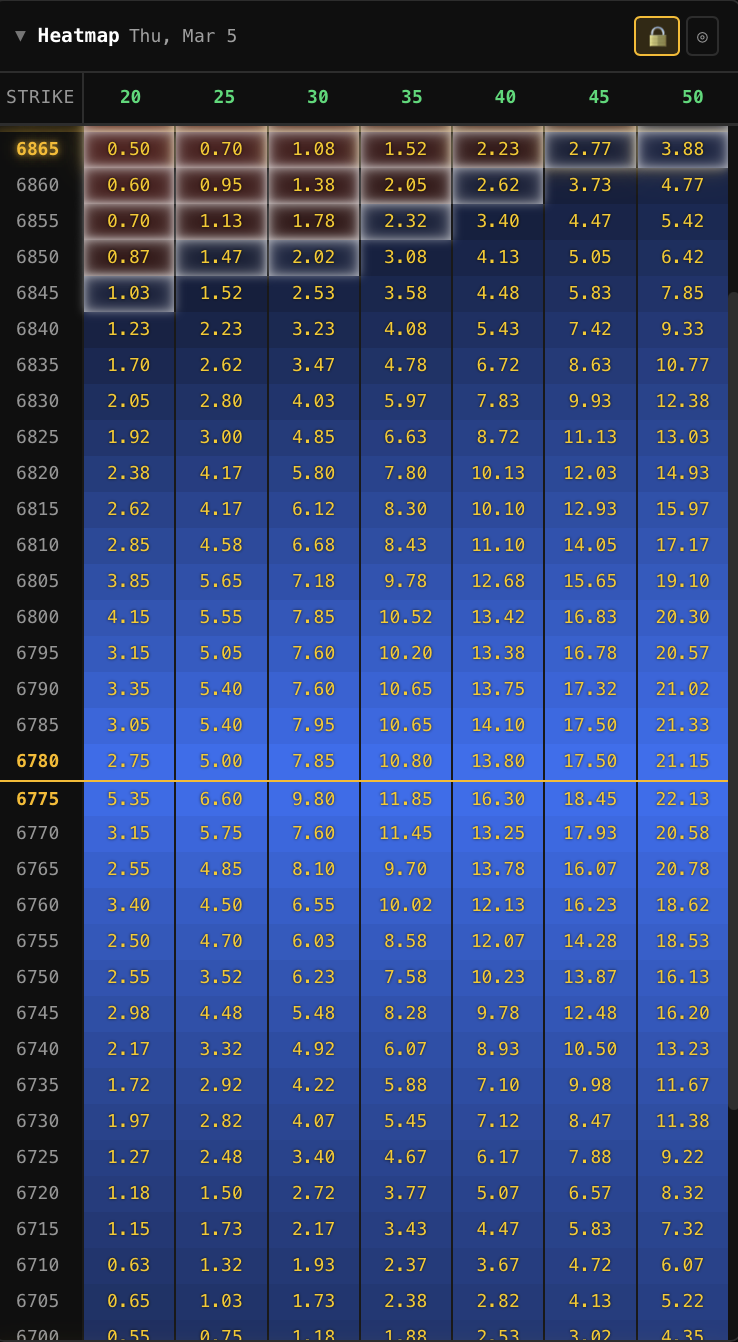
Open Interest. The total number of outstanding contracts at that strike. This is updated once daily, after the close. Open interest is the positioning story — it tells you where contracts have accumulated over time. A strike with 50,000 open interest represents significant positioning. When you combine open interest data across strikes, you start to see the landscape that feeds into gamma exposure analysis.
Implied Volatility. The market’s forecast of future volatility priced into the option. Higher IV means more expensive options. Lower IV means cheaper options. IV is not a prediction of direction — it is a prediction of magnitude. When IV is elevated, the market expects a large move. When it is compressed, the market expects range-bound behavior. The VIX is the aggregate IV of SPX options — the same number, just zoomed out to the index level.
Strike Price Selection and the Expected Move
The chain shows every available strike. Most traders pick strikes based on proximity to the current price or on delta targets. That is not wrong, but it misses a critical piece: the expected move.
The expected move is derived from at-the-money option pricing. It defines the range the market expects the underlying to trade within for a given expiration. You can calculate it directly from the chain: take the ATM straddle price (call bid + put bid at the strike nearest the current price). That straddle price, roughly, is the expected move in dollar terms.
Why does this matter? Because every strike you select exists within or outside the expected range. If you sell a credit spread with the short strike inside the expected move, the market is telling you there is a meaningful probability of that strike being breached. If you buy a debit spread with the long strike outside the expected move, you need the underlying to exceed what the market prices as likely.
When you read the options chain with the expected move in mind, strike selection stops being arbitrary. Every contract on the chain has a probability associated with it — and the chain itself gives you the data to calculate it.
Volume vs Open Interest: Positioning vs Activity
This is where most options chain tutorials fail. They explain what volume and open interest are. They do not explain what they mean together.
High volume, low open interest. Traders are active at this strike today, but there is no pre-existing position. This could be a new trade being opened or a one-day event. It tells you about today. It tells you nothing about structural positioning.
Low volume, high open interest. A large position was built at this strike previously, but nobody is trading it today. The position still exists. The contracts are still outstanding. When you read the options chain and see 40,000 open interest at a strike with 200 daily volume, that is a wall. It is there. It is not moving. Dealers who sold those contracts are hedging against them — and that hedging creates the gravity levels that GEX analysis maps.
High volume and high open interest. Active trading at a strike where significant positioning already exists. This is where the action is. New positions are being added or existing ones are being closed. This combination is what order flow analysts watch — it tells you where smart money is either building or unwinding exposure.
The chain shows you these numbers. It does not show you the direction of the trade — whether volume is opening or closing, buying or selling. That requires tools and data feeds beyond what any standard options chain provides.
The structural framework that FatTail teaches starts where the chain ends. The daily pre-market analysis in Observer ($17/week) takes the open interest data from the chain and transforms it into a GEX profile that shows you exactly where dealer hedging creates support and resistance. Activator ($97/month) adds real-time tools and weekly coaching. Navigator ($267/month) provides daily direct coaching with Ernie. Compare all plans here.
The Greeks on the Chain: What They Tell You
Most chains display delta, gamma, theta, and vega for each contract. These numbers change constantly. If you do not understand what they represent, they are clutter. If you do, they are the most useful columns on the chain.
Delta tells you the option’s sensitivity to a $1 move in the underlying. A 0.30 delta call gains roughly $0.30 when the stock moves up $1. Delta also approximates the market’s probability of expiring in the money — a 0.30 delta implies roughly a 30% chance of finishing ITM. When you read the options chain through the lens of delta, every strike has a probability attached to it.
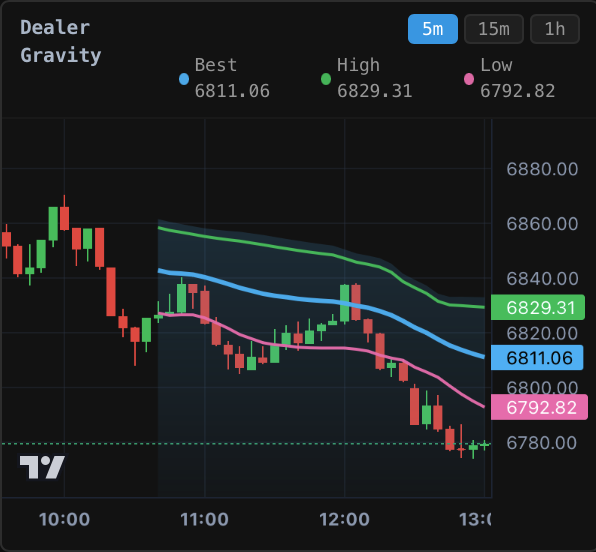
Gamma tells you how fast delta changes. High gamma means the option’s behavior accelerates near the money. For 0DTE traders, gamma is everything — it is why same-day options move explosively when price approaches the strike. Gamma on the chain tells you where the accelerant lives.
Theta tells you the daily time decay cost. A theta of -0.15 means the contract loses $15 per day, all else equal. Theta is the tax on holding options. It is also the income that options sellers collect. The chain makes this cost visible for every contract.
Vega tells you sensitivity to implied volatility changes. If vega is 0.10, a 1-point increase in IV adds $10 to the contract value. Before earnings, when IV crush is a real risk, vega on the chain tells you exactly how much value you stand to lose from volatility compression alone.
What the Chain Does Not Tell You
This is the section most options chain guides skip entirely. They teach you to read the data. They do not teach you where the data falls short.
The options chain does not tell you the direction of trades. Volume shows activity, not intent. You cannot see whether 10,000 contracts were bought to open or sold to close.
The chain does not tell you about market structure. It shows individual contracts in isolation. It does not aggregate the data into a positioning landscape. You see trees. You do not see the forest.
The chain does not tell you where dealers are hedging or where their gamma exposure flips from positive to negative. This matters because dealer hedging is the mechanical force that creates support, resistance, and price gravity in the index. The GEX profile — built from chain data but processed through a structural framework — shows you where these forces exist.
The chain does not tell you whether the current VIX regime favors range-bound or trending behavior. It does not tell you whether the expected move is compressing or expanding. It does not tell you whether to trade a vertical spread or a butterfly.
The chain gives you data. Structural analysis gives you context. One without the other is incomplete. Most traders stop at the chain and wonder why they cannot find consistent edge. The edge is not in reading the chain better. It is in reading what the chain feeds into — the positioning landscape, the dealer hedging map, the structural framework. Observer ($17/week) delivers the daily pre-market GEX and expected move analysis built from chain data. Activator ($97/month) adds real-time tools and weekly coaching. Navigator ($267/month) provides daily direct coaching with Ernie. Compare all plans here.
Frequently Asked Questions
What is an options chain?
An options chain is a table displaying all available option contracts for a specific underlying asset, organized by expiration date and strike price. It shows real-time data including bid, ask, last price, volume, open interest, implied volatility, and the Greeks for each contract. Every broker platform provides an options chain — the data is standardized, only the display varies.
How do you read an options chain for beginners?
Start with the bid-ask spread to assess liquidity — tight spreads mean active contracts, wide spreads mean illiquid ones you should avoid. Then look at volume and open interest to see where trading activity and positioning exist. Use delta to understand each strike’s approximate probability of expiring in the money. The chain is an information tool, not a trading signal — it shows you what the market is pricing, not what to trade.
What does open interest tell you on an options chain?
Open interest shows the total number of outstanding contracts at a given strike, updated daily after the close. High open interest indicates significant positioning — contracts that have been opened and not yet closed. When aggregated across all strikes, open interest data feeds into gamma exposure analysis that reveals where dealer hedging creates structural price levels. A single strike’s open interest tells you about that strike. The full open interest landscape tells you about the market.
What are the most important columns on an options chain?
The most important columns are bid-ask (liquidity), volume (today’s activity), open interest (accumulated positioning), implied volatility (expected magnitude of moves), and delta (probability and directional sensitivity). Gamma matters for short-dated options. Theta matters if you are holding positions overnight. Last price is the least useful — it is often stale and does not reflect current market conditions.
Can you use the options chain to predict price movement?
The options chain alone cannot predict price movement. It shows you current pricing and positioning but not trade direction or structural context. To move from chain data to actionable analysis, you need tools that aggregate open interest into gamma exposure profiles, map dealer hedging levels, and assess volatility regime context. The chain is the raw data. Structural frameworks like GEX analysis transform that data into a positioning landscape that informs trade selection.
FATTAIL BRIEFINGS
Get FatTail briefings in your inbox
Pick the lists you want. FOMC Alerts is selected by default.