


Open interest in options tells you how many contracts are currently active at a given strike and expiration. It is not volume. Volume counts how many contracts traded today. Open interest counts how many contracts exist right now—positions that were opened and not yet closed, exercised, or expired. The distinction matters because volume shows activity while open interest shows commitment. A strike with 50,000 open interest and 200 volume is a crowded position where nobody is moving. A strike with 200 open interest and 50,000 volume is a fresh battleground.
Most traders glance at open interest and move on. That is a mistake. Open interest is the foundation for understanding max pain calculations, dealer positioning, and the mechanical forces that pin prices at expiration. If you trade options without reading open interest, you are ignoring the structural map of where money is committed.
What Open Interest Actually Measures
Every options contract has a buyer and a seller. When a new buyer and a new seller create a contract, open interest increases by one. When an existing holder sells to an existing short, open interest decreases by one. When a new buyer purchases from an existing short who is closing, open interest stays the same—one position opened, one closed.
This means open interest is a net measure of outstanding positions, not a directional signal on its own. High open interest at a strike means many traders have positions there. It does not tell you whether they are bullish or bearish, long or short, hedging or speculating. That context comes from combining open interest with other data.
The Options Clearing Corporation (OCC) publishes official open interest data daily, updated after the close. Your broker’s open interest numbers reflect the previous day’s close, not real-time changes. Intraday, you can only infer open interest changes from volume relative to the prior day’s OI.
Open Interest vs Volume
Confusing open interest with volume is the most common mistake traders make with this data. Here is the difference in practice:
- Volume: Resets to zero every day. Counts every contract that traded during the session. A single contract bought and sold three times generates three in volume. Volume measures today’s activity.
- Open interest: Carries forward day to day. Only changes when new contracts are created or existing contracts are closed. If 10,000 contracts traded today but all were existing holders shuffling positions, open interest does not change. Open interest measures total commitment.
The relationship between the two reveals what is happening at a strike:
- High volume + rising open interest: New positions are being created. Money is flowing into this strike. This is the strongest signal of conviction—traders are committing fresh capital.
- High volume + falling open interest: Existing positions are being closed. Traders are leaving. This often happens after a catalyst resolves or ahead of expiration as positions are unwound.
- High volume + flat open interest: Positions are changing hands. One person’s exit is another’s entry. The strike is active but the total commitment is not growing.
- Low volume + high open interest: A crowded strike where nobody is moving. These positions are either long-term hedges or trapped traders waiting for a better exit. This is where gamma exposure concentrations build.
How Open Interest Drives Price
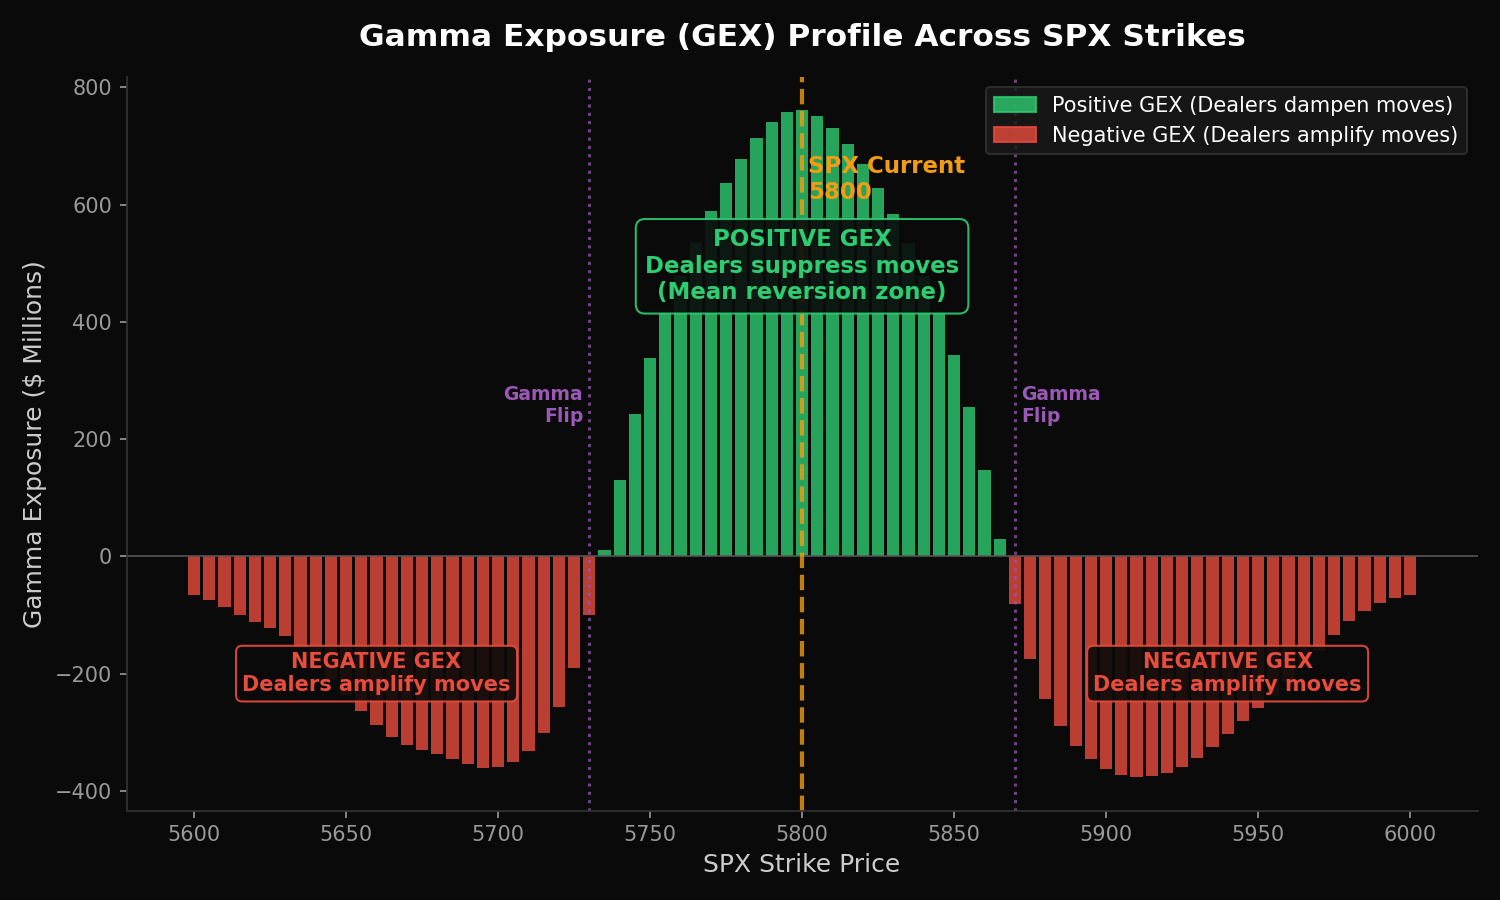
Open interest does not just describe the market—it actively shapes it. The mechanism works through dealer hedging:
Market makers who sell options to retail and institutional traders must hedge their exposure. When open interest is concentrated at a strike, market makers hold large hedging positions around that level. As the underlying approaches a strike with massive call open interest, dealers who are short those calls must buy shares to hedge (delta hedging). This buying creates support. Conversely, as price moves away, they sell shares. This creates the “pinning” effect near high-OI strikes at expiration.
This is not a theory—it is the mechanical foundation of max pain. The max pain price is the strike where the most open interest expires worthless, meaning dealers have to do the least hedging. The market gravitates toward that level because the hedging flows push it there.
Reading Open Interest on the Options Chain
When you look at an options chain, open interest appears as a column next to each strike. Here is what to look for:
Concentration Strikes
Identify the strikes with the highest open interest for both calls and puts. These are the structural levels where the most capital is committed. On SPX, you will often see round numbers ($5,000, $5,100, $5,200) with disproportionately high OI. These act as magnets near expiration and as support/resistance levels during the trading day.
Put-Call Open Interest Ratio
Compare total put open interest to total call open interest at each strike and across the chain. A strike with 30,000 put OI and 5,000 call OI is heavily put-dominant—many traders have downside protection or bearish bets at that level. The put/call ratio of open interest across the entire chain provides a sentiment reading of where the market’s hedging is concentrated.
Changes in Open Interest
A single day’s open interest snapshot is useful. The change in open interest over time is more useful. If the $520 call on SPY had 10,000 OI last week and has 45,000 today, someone is building a significant position. Whether that is a hedge, a directional bet, or an institutional roll matters—but the fact that capital is concentrating there is information you can act on.
Open Interest and Options Strategies
Open interest affects different strategies in different ways:
- Premium sellers: Sell options at strikes with high open interest. These strikes have more liquidity (tighter bid-ask spreads), and the market structure pinning effect works in your favour if you want the option to expire worthless. High-OI strikes are where premium collection strategies have the best execution and the most structural support.
- Spread traders: Check open interest at both legs of your spread. A credit spread with the short leg at a high-OI strike and the long leg at a low-OI strike has better pinning support on the important side. Avoid strikes with very low open interest—the bid-ask spread will be wide and fills will be poor.
- Directional traders: Rising open interest in calls at a specific strike combined with rising implied volatility suggests aggressive positioning for an upside move. This is not a guarantee of direction, but it shows where smart money is committing capital. Combine with order flow data for confirmation.
- 0DTE traders: On same-day expiration, open interest is less relevant because most positions were opened that morning (they show up in volume, not OI). For 0DTE, use the expected move and GEX levels calculated from the prior day’s open interest at weekly and monthly expirations—these are the hedging positions that drive intraday price action.
Open Interest in Options at Expiration
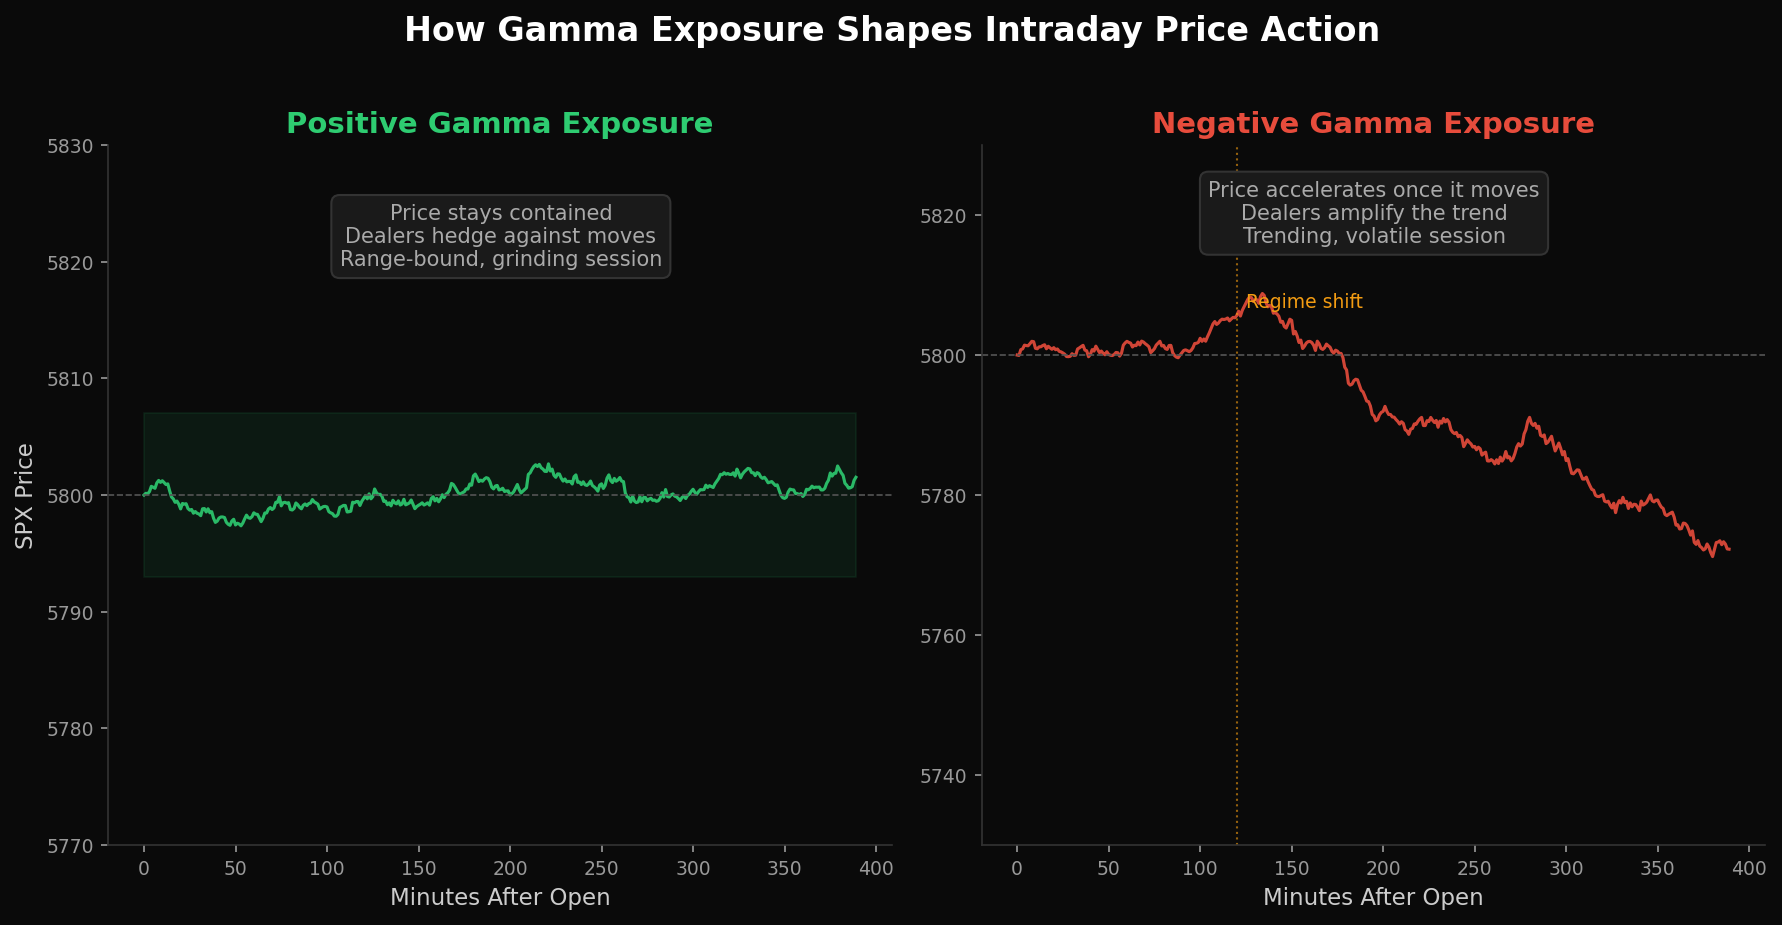
Open interest becomes most powerful in the final days before expiration. As time decay accelerates, the gamma of near-the-money options increases dramatically. Dealers who are hedging high-OI strikes must buy and sell shares more aggressively to stay delta-neutral. This creates the expiration-week phenomena that every options trader has experienced:
- Pinning: The underlying gravitates toward the strike with the highest open interest. This is not manipulation—it is the mechanical result of dealer hedging flows. The more open interest at a strike, the stronger the gravitational pull.
- Expiration breakouts: When the underlying moves away from a high-OI strike, the hedging flows reverse and accelerate the move. This is negative gamma in action. The hedging that was stabilising price becomes destabilising once the pin breaks.
- Max pain convergence: The price tends to settle near max pain—the strike where total open interest (calls + puts) expires with maximum loss for option holders. Check max pain before expiration week to identify the likely gravitational centre.
Where to Find Open Interest Data
Open interest is available from multiple sources, each with different levels of detail:
- Your broker’s options chain: Shows OI per strike. Updated daily (reflects previous close). Sufficient for most traders. Thinkorswim, Tastytrade, and IBKR all display OI prominently. The CBOE’s SPX options page also provides open interest summaries for index products.
- OCC daily reports: The official source for open interest data. Published after each trading day. Use this for verification or research.
- GEX tools: Services like the FatTail platform translate raw open interest into gamma exposure profiles, showing exactly where dealer hedging will create support and resistance. This is the most actionable form of open interest analysis for market analysis.
Common Mistakes with Open Interest
- Treating open interest as directional. High call open interest does not mean the market is bullish. Those calls could be hedges against short stock positions, covered calls against long stock, or speculative bets that are currently underwater. Open interest tells you where positions exist, not which direction they face.
- Ignoring the time dimension. Open interest from monthly expirations that are six weeks away has different implications than weekly expiration OI. Monthly OI reflects institutional hedging and structural positioning. Weekly OI reflects shorter-term speculation. Do not treat them the same.
- Using open interest on illiquid options. Open interest of 50 contracts at a strike means nothing actionable. The position could be one trader’s small hedge. Open interest analysis works best on liquid underlyings (SPX, SPY, QQQ, AAPL) where OI of 10,000+ at key strikes reflects broad market participation.
- Confusing today’s volume with tomorrow’s open interest. If 20,000 contracts traded today at a strike with 5,000 prior OI, tomorrow’s OI could be anywhere from 5,000 to 25,000 depending on whether those trades opened new positions or closed existing ones. Wait for the official OI update before drawing conclusions.
- Not combining with other data. Open interest alone is a blunt instrument. Combine it with volume trends, implied volatility changes, GEX profiles, and skew to build a complete picture. The most useful open interest analysis asks “what will dealers do if price moves here?”—and answering that requires more than just the OI number.
Frequently Asked Questions
What is open interest in options?
Open interest is the total number of outstanding options contracts at a specific strike price and expiration that have not been closed, exercised, or expired. It increases when new contracts are created (a new buyer and a new seller open a position) and decreases when existing contracts are closed. Open interest is updated daily after the market close and represents the total commitment of capital at each strike.
Is high open interest bullish or bearish?
Neither. High open interest shows where positions are concentrated, not the direction of those positions. High call open interest could represent bullish speculation, covered call selling, or hedging against short stock. The directional signal comes from combining open interest with volume trends, implied volatility changes, and whether the open interest is increasing or decreasing. Rising call OI with rising IV is more bullish than flat call OI with falling IV.
How does open interest affect option prices?
Open interest indirectly affects prices through liquidity and dealer hedging. Strikes with high open interest typically have tighter bid-ask spreads, making them cheaper to trade. More importantly, high OI creates concentrated dealer hedging positions that generate mechanical support and resistance levels. Near expiration, these hedging flows can pin the underlying price to the highest-OI strike or accelerate moves when the pin breaks.
What does it mean when open interest increases?
Rising open interest means new positions are being created. When volume exceeds the prior day’s open interest change, and OI is increasing, fresh capital is flowing into that strike. This signals conviction — traders are committing new money rather than simply trading existing positions. Rising OI combined with rising prices in the underlying is generally considered a confirmation of the current trend.
Should I trade options with high or low open interest?
Trade options with high open interest for better liquidity. High-OI strikes have tighter bid-ask spreads, better fill prices, and more predictable behavior near expiration due to dealer hedging effects. Low-OI strikes may have wide spreads (costing you money on entry and exit) and less predictable price action. For premium selling strategies, high-OI strikes also benefit from the pinning effect that helps short options expire worthless.
FATTAIL BRIEFINGS
Get FatTail briefings in your inbox
Pick the lists you want. FOMC Alerts is selected by default.