


FOMC Alerts · October 21, 2026
The Fed doesn’t own the 10-year
Why is the 10 year Treasury yield rising? Start with what the Fed actually controls. On Oct 28 it can move the overnight rate. It can’t make anyone buy a 10-year note. That price gets set by everyone who has to decide whether to lend Washington money for a decade.
Over the past year the 10-year yield climbed from 3.98% to 5.13%, and the 2-year went from 3.45% to 4.81%, according to Treasury’s daily curve (U.S. Treasury, Oct 21, 2025 vs Oct 21, 2026). The short end rose more, so the curve actually got flatter: the gap between the 2-year and the 10-year shrank from 53bp to 32bp. So the honest answer to “why is the 10 year Treasury yield rising?” has two parts: expected Fed policy and something else. That something else is the term premium, and it’s where Treasury supply comes in.
Ray Dalio made the supply case in an Oct 13 essay on his Substack (Principled Perspectives). His bottom line: “the bond bear market probably has a long way to go, and we should be alerted to the other markets’ possible weakness.” He also notes the piece isn’t investment advice. We took his numbers and checked them against Treasury’s own data.
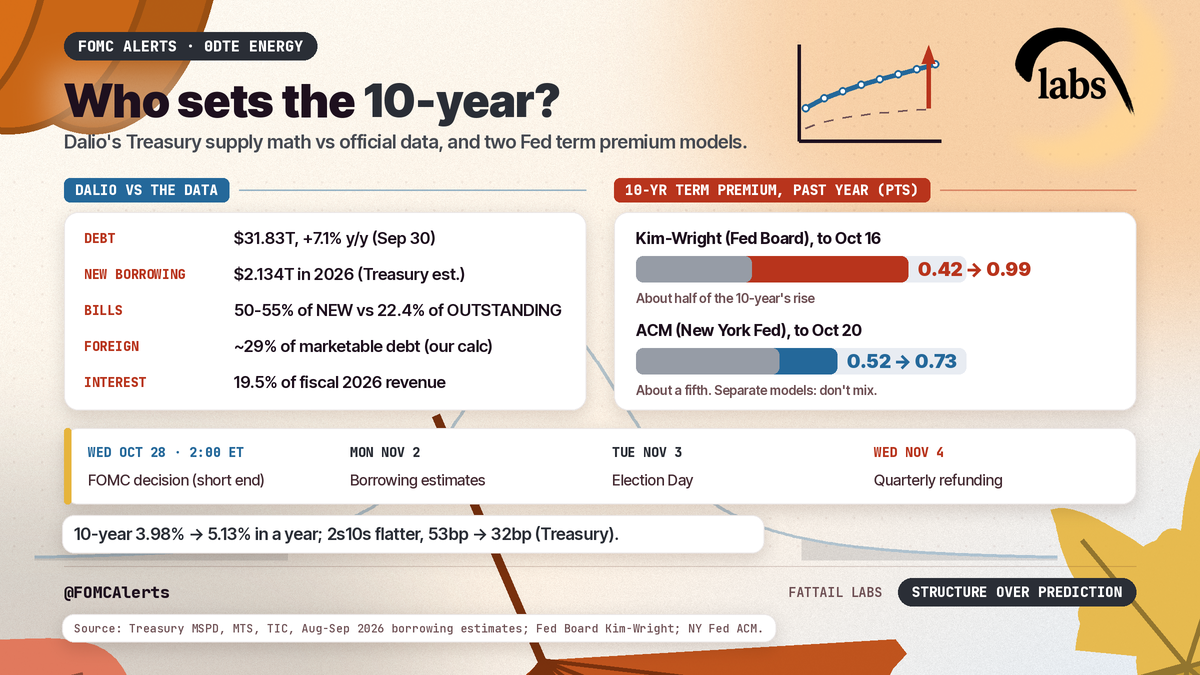
Dalio’s supply math, checked
Most of the ledger holds up. A few lines need a fix, and one compares two different things.
| Line | Dalio | Official data | Verdict |
|---|---|---|---|
| Marketable debt | ~$32T, up ~8% in a year | $31.83T on Sep 30, up 7.1% | Size right; growth closer to 7% |
| New borrowing in 2026 | ~$2.1T | $2.134T (two quarters actual, two Treasury estimates) | Matches Treasury’s own estimate |
| Interest as a share of revenue | ~21% (his chart) | 19.5% in fiscal 2026 ($1.052T of $5.403T) | Official figure is a bit lower |
| Average rate on the debt | ~3.5% | 3.518% on Sep 30 | Matches |
| Debt service incl. rollovers | ~200% of revenue | $10.64T due in 12 months = 197% of fiscal 2026 receipts; 216% with net interest (our calc) | Ballpark; his framing, not an official metric |
Sources for the official column: the Monthly Statement of the Public Debt (Treasury), the Monthly Treasury Statement (Treasury), average interest rates (Treasury) and Treasury’s August borrowing estimates (Treasury).
That $10.64 trillion sounds scary, and it needs context. It’s all $7.12 trillion of bills plus $3.52 trillion of longer debt maturing by Sep 30, 2027. Most of it gets rolled over routinely. It measures how much has to be refinanced, not new money. The cost side is the real squeeze: the debt carries an average rate of about 3.5%, while today’s curve runs from 4.09% to 5.47%. By our math, every extra percentage point on $31.8 trillion adds roughly $318 billion a year once the whole stock rolls over.
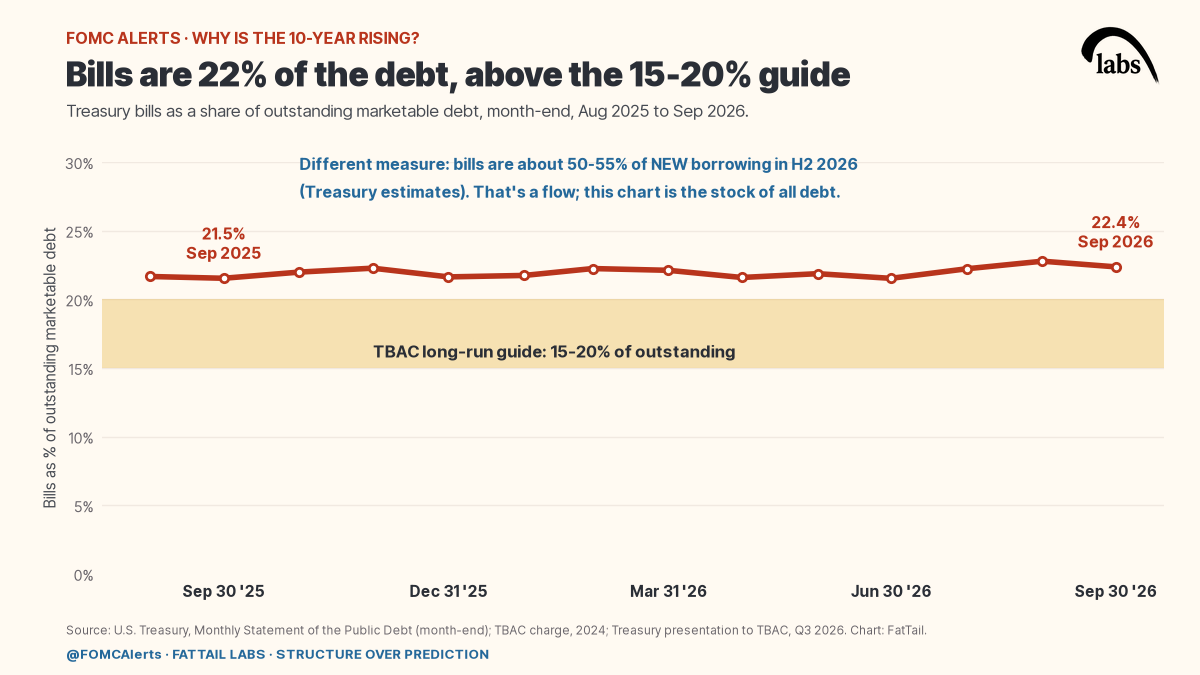
Then there’s the bills claim, the one that compares two different things. Bills, the debt that matures in a year or less, make up about half of Treasury’s new borrowing in the second half of 2026: 55% of the July-September total and 50% of October-December, based on Treasury’s estimates (Treasury presentation to TBAC). But bills are 22.4% of outstanding debt, up from 21.5% a year ago. The Treasury Borrowing Advisory Committee’s long-run guide of 15-20% refers to that outstanding share (TBAC). Half of new borrowing and 22% of the total are both true. They just aren’t the same measure.
Who’s buying Treasuries?
Foreign investors held $9.33 trillion of Treasuries in August, up 0.9% from a year earlier (Treasury TIC data). The marketable debt they’d need to keep pace with grew 7.1%. By our calculation, foreigners hold about 29% of marketable debt (Dalio puts it near 32%).
The mix is shifting. Japan, still the biggest holder, is down 9.8% in a year to $1.068 trillion. China is down 15.6% to $590.7 billion. The UK has moved above $1 trillion. Dalio argues Japan has reasons to bring money home and that Middle Eastern oil exporters now need to buy less US debt. That last point is his argument: custody data show Saudi and UAE holdings slightly up over the year. His summary is that he doesn’t expect foreign buying to carry the load.
The Fed holds about 14%. Since Sep 16 it has been buying bills to keep bank reserves ample (Federal Reserve). That’s plumbing, not quantitative easing, and it doesn’t buy 10-year notes.
Advertisement · From FatTail Labs

Observer: train with Coach for $17/week
A six-week trial and training program built to install pro trading habits: live daily coaching, courses, a Discord trade room and the full FatTail platform.
Treasury term premium, in plain English
Term premium is the extra yield investors want for locking money up for 10 years instead of rolling short-term bills the whole time. You can’t observe it directly. Economists estimate it with models, and the two best-known Fed models disagree on how much of this year’s move it explains.
| Model | 10-year term premium, past year | Share of the 10-year’s ~1-point rise | Early-October peak |
|---|---|---|---|
| Kim-Wright (Fed Board; FRED THREEFYTP10) | 0.42 → 0.99 points (to Oct 16) | about half | 1.10 on Oct 5, highest since April 2010 |
| ACM (New York Fed) | 0.52 → 0.73 points (to Oct 20) | about a fifth | 0.98 on Oct 7, highest since June 2014 |
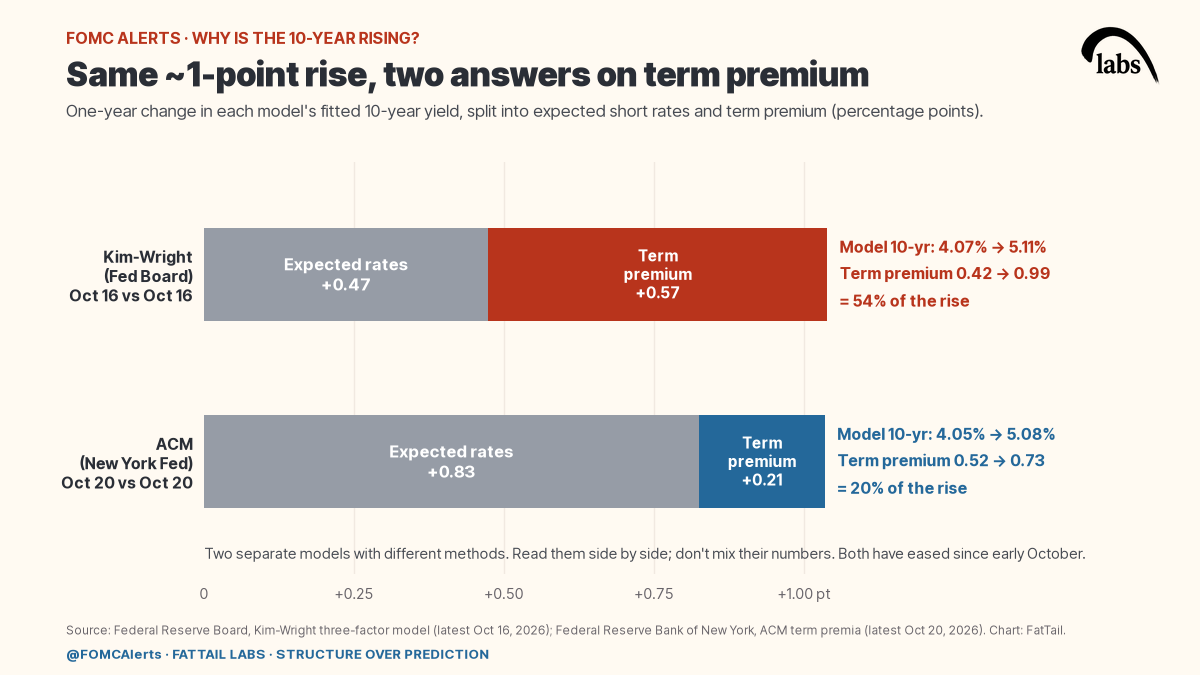
Sources: Federal Reserve Board and New York Fed. These are two separate models, so don’t mix their numbers. Read together, they say supply and the term premium matter, but how much depends on whose model you trust. Both have eased since early October.
Why Oct 28 may move the 2-year more
Fed days move the short end hardest. Across 93 scheduled decisions since 2015, the 2-year’s median move on Fed days was 4bp, double its 2bp on other days. The 10-year’s was 4bp vs 3bp. On the Sep 16 hike, the 2-year rose 7bp and the 10-year 1bp. Then the 10-year climbed from 5.01% to 5.31% by Oct 5 with no meeting in between. That’s a description of what happened, not proof of what caused it. For what’s priced for Oct 28 itself, see how to read fed funds futures probability.
The bond market’s own calendar
The long end has its own scheduled event, and it lands a week after the Fed. Treasury releases its borrowing estimates on Mon Nov 2 and its quarterly refunding announcement, which sets auction sizes, on Wed Nov 4 (Treasury). Treasury hasn’t posted times; last quarter the estimates came at 3:00 PM ET and the announcement at 8:30 AM ET. The midterm elections fall in between, on Nov 3.
The line to watch is from August: “Based on current projected borrowing needs, Treasury anticipates maintaining nominal coupon and FRN auction sizes for at least the next several quarters.” (Treasury) Dealers advising Treasury see coupon increases sometime in 2027 (TBAC minutes). If that August language changes, it’s news for the 10-year. The next foreign-holdings report (September data) is due Nov 18.
The full Fed calendar is on our FOMC meeting schedule for 2026, and every piece we’ve written ahead of Oct 28 is on the FOMC Alerts hub.
Dalio’s bigger numbers (his estimates)
Dalio goes further than Treasury debt, and these figures are his estimates, not official data:
- About $4.4 trillion of total US net fixed-income borrowing needs in 2027: federal, corporate (with AI a big share), household and state and local, before rollovers.
- About $220 billion of AI hyperscaler bond issuance in the first half of 2026, vs about $108 billion in all of 2025.
- A $1.8 trillion annualized pace of corporate equity issuance in the first half, gross, before buybacks and M&A.
His point is that bonds and stocks are competing for the same savings. We can’t check those totals against official data yet, so treat them as one investor’s ledger.
What it means for 0DTE
- Event risk: Oct 28 at 2:00 PM ET is the short end’s event. Nov 2 and Nov 4 are the long end’s, with Election Day in between. Same week, different drivers.
- Premium: The VIX sets the price of SPX options. A rates move on a non-Fed day can still reprice it, so check it before each of those dates, not just Oct 28.
- Structure: Keep risk defined and know your max loss before entry. A refunding surprise at 8:30 AM ET hits before the cash open.
- Plan, don’t predict: Two scenarios for Nov 4: Treasury keeps auction sizes steady, or it signals bigger coupons. Plan both. Neither is a call.
Related reading
- Fed Rate Lower, Mortgages Higher: The 10-Year Sets Housing: what a 5% 10-year does to mortgage rates.
- How to Plan Market Scenarios for 0DTE SPX: turning the two Nov 4 scenarios into a written plan.
- All FOMC Alerts coverage: every Fed, rates and data piece in one place.
Sources
- The Numbers Behind the Bond Bear Market (with a Look at Equities) (Ray Dalio, Principled Perspectives (Substack), Oct 13, 2026)
- Monthly Statement of the Public Debt (Tables 1 and 3) (U.S. Treasury, Fiscal Service, data as of Sep 30, 2026)
- Monthly Treasury Statement (Tables 1 and 9) (U.S. Treasury, Fiscal Service, fiscal 2026)
- Average Interest Rates on U.S. Treasury Securities (U.S. Treasury, Fiscal Service, Sep 30, 2026)
- Treasury Announces Marketable Borrowing Estimates (U.S. Treasury, Aug 3, 2026)
- Quarterly Refunding Statement (U.S. Treasury, Aug 5, 2026)
- Minutes of the Treasury Borrowing Advisory Committee Meeting (U.S. Treasury, Aug 2026)
- Treasury Presentation to TBAC, Q3 2026 (U.S. Treasury, Aug 2026)
- TBAC charge on bill share (Q3 2024) (Treasury Borrowing Advisory Committee, 2024)
- Most Recent Quarterly Refunding Documents (U.S. Treasury, accessed Oct 21, 2026)
- Major Foreign Holders of Treasury Securities (TIC Table 5) (U.S. Treasury, Aug 2026 data, released Oct 16, 2026)
- Daily Treasury Par Yield Curve Rates (U.S. Treasury, Oct 21, 2026)
- Three-Factor Nominal Term Structure Model (Kim-Wright) (Federal Reserve Board, data to Oct 16, 2026)
- ACM Term Premium (Federal Reserve Bank of New York, data to Oct 20, 2026)
- Federal Reserve issues FOMC statement (implementation note) (Federal Reserve, Sep 16, 2026)
Trade it with structure
Observer is a six-week trial and training program: train with Coach for $17/week. You get everything a full coaching member gets, every week, and the six weeks are designed to install pro trading habits: courses on strategy, process and risk management, live daily coaching, a Discord trade room with hundreds of experienced traders, and the platform (heatmap, GEX tools, risk graph, position analyzer and journal). Start Observer.
Educational content, not investment advice. Options involve risk and are not suitable for all investors.
FATTAIL BRIEFINGS
Get FatTail briefings in your inbox
Pick the lists you want. FOMC Alerts is selected by default.