


What a Butterfly Spread Is and Why It Exists
A butterfly spread is a three-leg options strategy that profits when the stock finishes near a specific price at expiration. You buy one option at a lower strike, sell two options at a middle strike, and buy one option at a higher strike — all with the same expiration. The result is a position with limited risk, limited reward, and a defined profit zone centred on the middle strike.
The butterfly spread exists because it answers a question no other strategy handles as efficiently: “What if I believe the stock will be at approximately this price by expiration?” Vertical spreads express directional bets. Straddles express magnitude bets. The butterfly spread expresses a precision bet — and when you are right about the pin price, the payoff relative to the cost is exceptional.
How a Butterfly Spread Is Constructed
Every butterfly has three strikes with equal spacing between them. The standard construction using calls:
- Buy 1 call at the lower strike (the lower wing)
- Sell 2 calls at the middle strike (the body)
- Buy 1 call at the upper strike (the upper wing)
You pay a net debit to enter. This debit is your maximum loss. The maximum profit occurs when the stock is exactly at the middle strike at expiration — the two short calls are at the money (maximum time value eroded to zero), the lower call is in the money by the wing width, and the upper call expires worthless. The CBOE options product specifications detail the standard contract terms (multiplier, settlement, exercise style) that govern how butterfly legs settle at expiration.
Example: Stock XYZ at $100. Buy the $95/$100/$105 call butterfly. Buy 1 $95 call for $7.00, sell 2 $100 calls for $4.00 each (-$8.00), buy 1 $105 call for $2.00. Net debit: $7.00 – $8.00 + $2.00 = $1.00 ($100 per contract).
- Maximum profit: $5.00 – $1.00 = $4.00 per share ($400 per contract) — occurs at $100 at expiration
- Maximum loss: $1.00 per share ($100 per contract) — the debit paid
- Lower breakeven: $96.00 ($95 strike + $1.00 debit)
- Upper breakeven: $104.00 ($105 strike – $1.00 debit)
- Risk-reward ratio: risk $100 to make $400 — 4:1 reward-to-risk
That 4:1 payoff is why butterflies attract attention. The catch is that the stock must finish within a narrow range — between $96 and $104 in this example — for any profit at all.
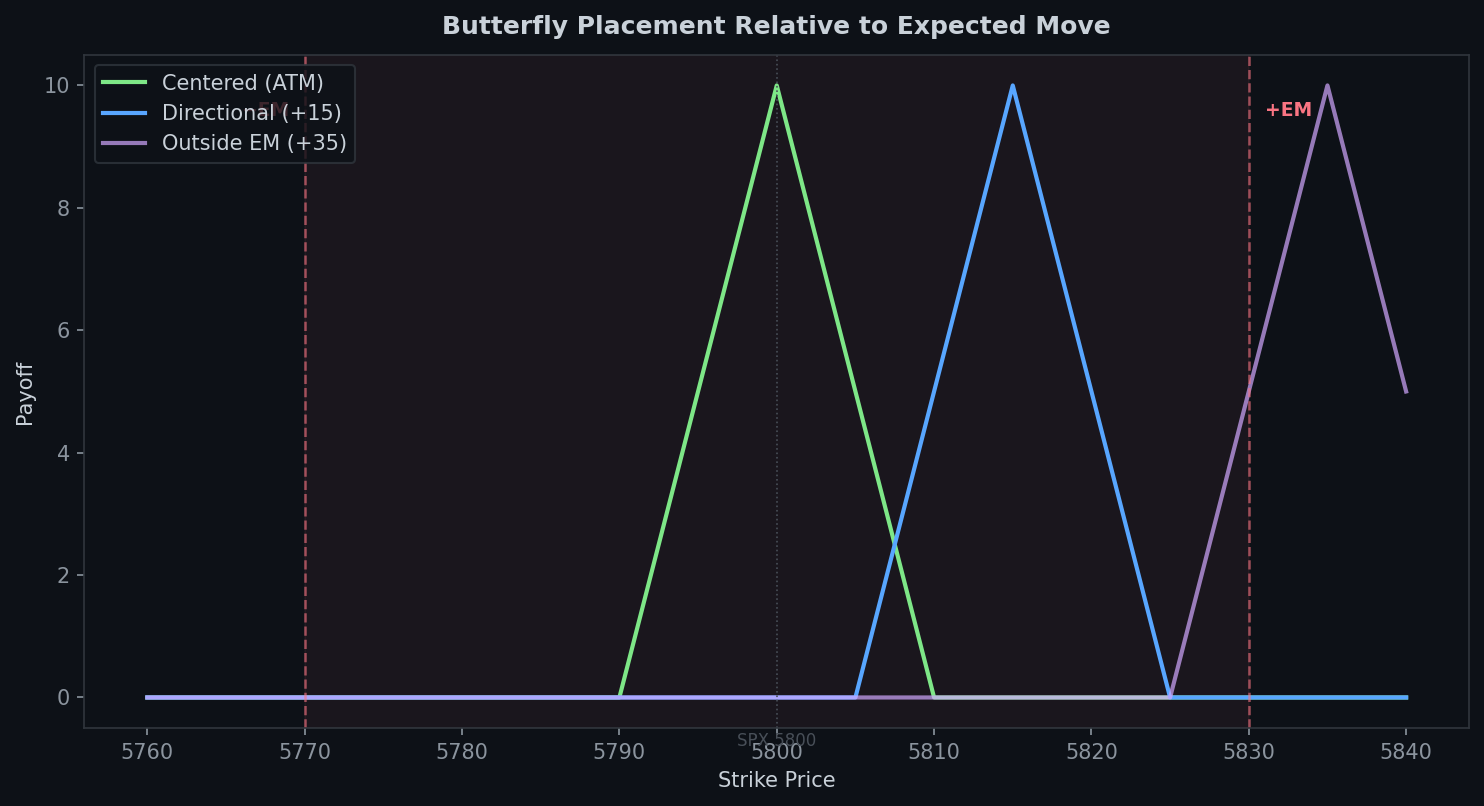
Call Butterfly vs Put Butterfly
You can build a butterfly with all calls or all puts. The payoff diagram is identical — same max profit, same max loss, same breakevens. The difference is practical, not theoretical:
Call butterfly: Buy lower call, sell 2 middle calls, buy upper call. This is the standard construction. Entered for a debit. Call butterflies are slightly easier to execute on most platforms and have tighter bid-ask spreads on high-volume underlyings because call options generally have higher open interest at or near the money.
Put butterfly: Buy upper put, sell 2 middle puts, buy lower put. Also entered for a debit. Put butterflies may have a slight edge when implied volatility skew favours puts (out-of-the-money puts are more expensive than equidistant calls). In practice, the difference is marginal. Most traders default to call butterflies unless the put side offers meaningfully better pricing.
The practical choice: Use whichever side has tighter bid-ask spreads and more liquidity at the strikes you want. On SPY, QQQ, and other high-volume underlyings, it rarely matters. On less liquid stocks, check both sides and choose the one with better fills.
Long Butterfly vs Short Butterfly
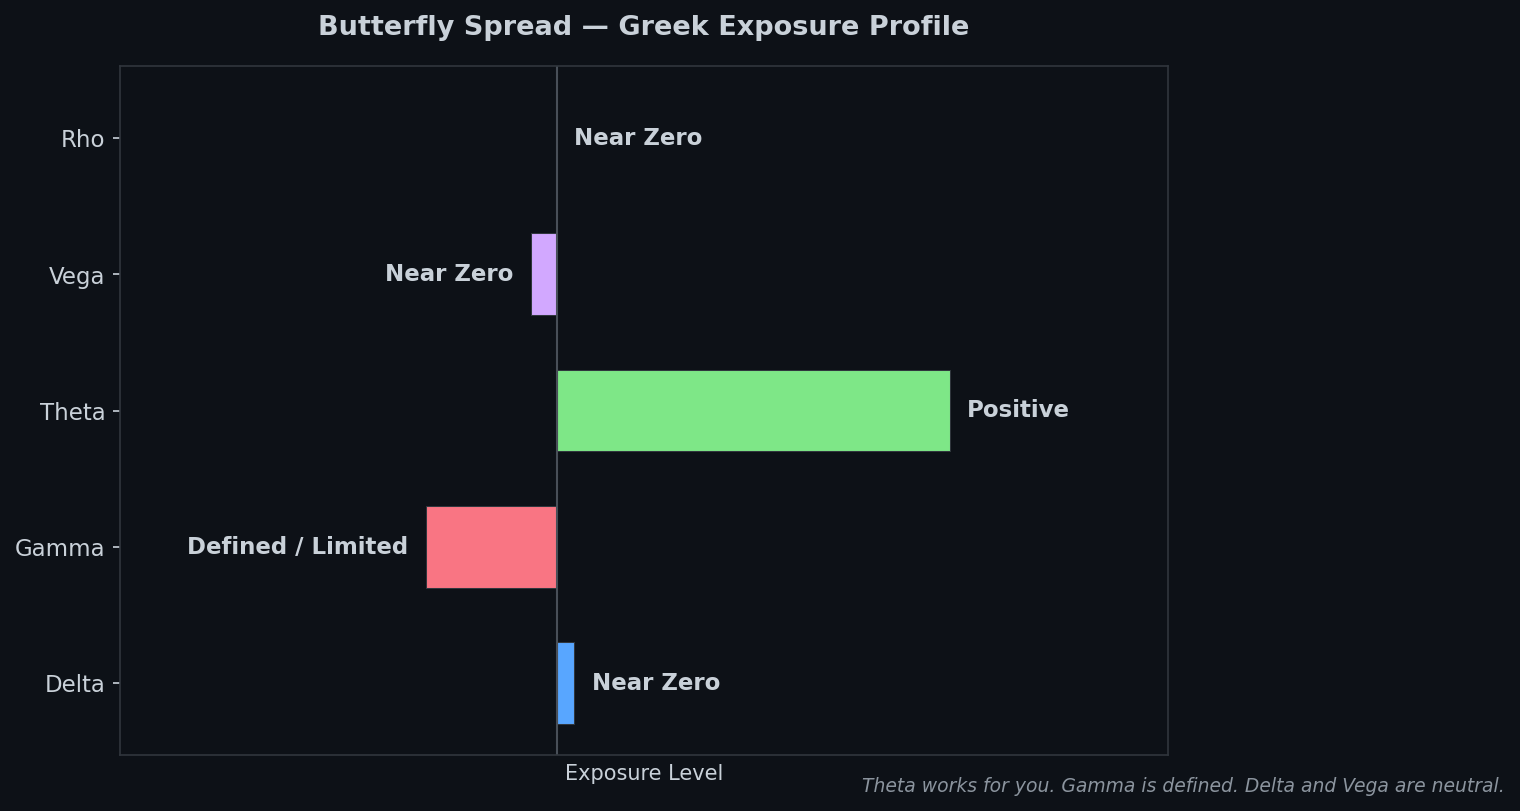
Long butterfly (debit): The standard construction described above. You pay a debit and profit if the stock pins near the middle strike. You are betting on low realised volatility — you want the stock to sit still near your target price. Long butterflies are long theta as expiration approaches (if the stock is near the middle strike) because the two short options at the body are decaying faster than the wings.
Short butterfly (credit): The inverse — sell 1 lower call, buy 2 middle calls, sell 1 upper call. You collect a credit and profit if the stock moves away from the middle strike in either direction. You are betting on high realised volatility. Short butterflies are rarely used as standalone strategies because the risk-reward is unfavourable — you collect a small credit and risk a larger loss if the stock pins.
For the rest of this guide, “butterfly spread” refers to the long butterfly unless stated otherwise. It is the vastly more common application.
Setting Up a Butterfly Spread
Choosing the centre strike
The centre strike is your target price — where you expect the stock to be at expiration. This is the most important decision:
- At the money (current stock price): The most common placement. You are betting the stock stays near its current price through expiration. Best for range-bound stocks or after a move when you expect consolidation.
- Above the current price: You expect the stock to rally to a specific level. Place the centre strike at your target. Example: stock at $100, you expect a move to $110 — centre the butterfly at $110 with a $105/$110/$115 structure.
- Below the current price: You expect a pullback to a specific level. Place the centre strike at your support target. This is less common but works for expected pullbacks to known support.
Wing width
The distance between the centre strike and each wing defines your cost, maximum profit, and profit zone width:
Narrow wings ($1-$2): Cheaper to enter (lower debit) but very narrow profit zone. The stock must pin almost exactly at the centre strike. Best on high-priced underlyings where $1-$2 strikes are available and the percentage move required is small.
Standard wings ($5): The practical default for most butterflies. Wide enough profit zone to be realistic, affordable enough to maintain favourable risk-reward. The $5-wide butterfly is the workhorse of butterfly trading.
Wide wings ($10+): Wider profit zone but higher debit. The cost increases faster than the maximum profit as wings widen, reducing the risk-reward ratio. Wide-wing butterflies are useful when you have a target zone rather than a specific pin price.
Choosing expiration
7-14 DTE: Maximum gamma exposure. The butterfly’s value changes rapidly as the stock approaches or moves away from the centre strike. Best for experienced traders with high conviction on a specific pin by a specific date (common around options expiration, when max pain dynamics can pin stocks near high open interest strikes).
21-45 DTE: The standard entry window. Enough time for the trade to develop, but theta decay is beginning to accelerate on the short legs. Enter at 30-45 DTE and manage as expiration approaches.
45+ DTE: The butterfly has minimal theta benefit early in its life. The position’s value is driven primarily by changes in the stock price and IV, not time decay. Only use longer expirations if you are entering ahead of an event (earnings in 6 weeks) and want the butterfly centred at a post-event target.
Butterfly Spread Payoff and Breakeven Math
The butterfly’s payoff diagram is a tent shape with the peak at the centre strike:
At expiration:
- Below the lower wing: loss equals the debit paid (all options worthless or offset)
- Between the lower wing and centre strike: profit increases linearly from zero at the lower breakeven to maximum at the centre
- At the centre strike: maximum profit = wing width minus debit paid
- Between the centre strike and upper wing: profit decreases linearly from maximum to zero at the upper breakeven
- Above the upper wing: loss equals the debit paid (options offset each other)
Breakeven formulas:
- Lower breakeven = lower strike + debit paid
- Upper breakeven = upper strike – debit paid
Key ratio: Divide the debit by the wing width to assess the trade’s cost efficiency. A $1.00 debit on a $5-wide butterfly is 20% — you risk 20% of the wing width. The lower this percentage, the better the risk-reward. Below 25% is attractive. Above 40% means the butterfly is expensive relative to its potential payoff. The OCC options calculator can help you model these payoff scenarios before entering a trade.

Butterfly Spread vs Iron Butterfly
This is the most common source of confusion. Both have the same payoff shape. The difference is construction:
Butterfly spread (debit): Three legs using all calls (or all puts). Entered for a debit. Maximum loss is the debit paid. Simpler to execute — one order, three legs, same option type.
Iron butterfly (credit): Four legs using both calls and puts. Sell an ATM straddle (1 call + 1 put at the centre) and buy wings (1 OTM put below, 1 OTM call above). Entered for a credit. Maximum loss is the wing width minus credit received. More capital-efficient for selling because the credit reduces margin requirements.
When to use which:
- Use the debit butterfly when you are buying the structure (long butterfly) — the debit clearly defines your max loss and requires no margin
- Use the iron butterfly when you are selling the structure (short iron butterfly) — the credit reduces your cost basis and the margin efficiency is better for accounts that trade on margin
- Use either when the payoff is the same — check which has tighter bid-ask spreads on the specific underlying
Butterfly Spread vs Iron Condor
Both are range-bound strategies. The difference is profit zone shape:
Butterfly: Maximum profit at one specific price (the centre strike). Profit zone is narrow and peaked. Best when you have a specific target price in mind.
Iron condor: Maximum profit across a range of prices (between the two short strikes). Profit zone is wider and flat-topped. Best when you believe the stock will stay within a range but you do not have a specific target price.
The trade-off: The butterfly offers a higher maximum profit relative to cost but requires more precision. The condor offers a wider margin of error but lower maximum profit relative to risk. If you think the stock will be “around $100,” use a butterfly. If you think it will be “somewhere between $95 and $105,” use a condor.
When to Use a Butterfly Spread
Earnings pinning. Before earnings, you expect a specific post-earnings price based on your analysis. A butterfly centred at that target captures the precision bet cheaply. If the stock pins near your target, the butterfly can return 3-5× the debit. If it does not, you lose a small, defined amount.
Expiration pinning. Near monthly options expiration, stocks sometimes pin near strikes with high open interest due to dealer hedging dynamics. Placing a butterfly at the expected pin strike with 3-7 DTE is a directional bet on this market microstructure effect.
Range compression. After a period of high volatility, stocks often compress into a narrow range. Butterfly spreads profit from this compression because the stock staying near one price is the ideal outcome. Enter the butterfly during elevated IV (which makes the debit cheaper due to the two short options absorbing more IV premium) and profit as the stock settles and IV compresses.
Low-cost directional bet. If you believe a stock will reach a specific price but do not want to risk more than $100-$200 per contract, a butterfly gives you that exposure. The debit is small relative to a vertical spread or long option, and the payoff if correct can be 3-5×. It is a cheap lottery ticket with better odds than most lottery tickets.
Managing a Butterfly Spread After Entry
Profit target: 50-75% of maximum profit. Do not wait for the stock to pin exactly at the centre strike at expiration. That outcome is rare. If the butterfly appreciates to 50-75% of theoretical maximum, close it. A $1.00 debit butterfly with $4.00 max profit should be closed at $2.50-$3.50 (the spread value, not the profit). The last 25-50% of profit requires the stock to be within a very narrow range at expiration — not worth the gamma risk.
Time-based exit: close by 7-10 DTE unless pinning. If the stock is near the centre strike with 7-10 DTE remaining and the butterfly is profitable, consider closing. Gamma accelerates in the final week, and the stock moving just $1-$2 away from the centre can wipe out profits rapidly. Only hold into the final days if you are specifically playing an expiration pin.
The stock moves away from the centre strike. If the stock moves to or beyond one of the wings early in the trade, the butterfly’s value declines toward the debit paid. Since the debit is your max loss and it is small, there is no rush to close — the butterfly cannot lose more than the debit. Let it sit. The stock may return to the centre. If there are fewer than 10 DTE and the stock is at a wing, close for whatever residual value remains.
Adjustments are rarely worth it. Unlike other spreads where rolling or adjusting is standard, butterflies are best treated as set-and-forget trades with a defined exit plan. The cost of adjusting (commissions plus bid-ask slippage on three legs) often exceeds the benefit. Enter the butterfly with your target, set your profit and time exits, and accept the result.
Butterfly Spread Example: Earnings Pin on XYZ
Stock XYZ is at $148, reporting earnings in 10 days. Your analysis suggests the stock will settle near $145 after earnings — a modest pullback on lukewarm guidance. IV is elevated at the 72nd percentile.
Setup: Buy the $140/$145/$150 call butterfly with 10 DTE. Buy 1 $140 call for $9.50, sell 2 $145 calls for $6.50 each (-$13.00), buy 1 $150 call for $4.30. Net debit: $9.50 – $13.00 + $4.30 = $0.80 ($80 per contract).
Risk parameters:
- Maximum profit: $5.00 – $0.80 = $4.20 per share ($420 per contract)
- Maximum loss: $0.80 per share ($80 per contract)
- Lower breakeven: $140.80
- Upper breakeven: $149.20
- Risk-reward: risk $80 to make $420 — 5.25:1
- Profit target: close at $2.50 spread value ($170 profit, ~40% of max)
Scenario A — stock settles at $144.50 after earnings (near pin): The butterfly is worth approximately $3.80 with 3 DTE remaining. Close for $3.80. Net profit: $3.00 per share ($300 per contract). The stock landed within $0.50 of the centre strike — the butterfly captured most of its potential value.
Scenario B — stock drops to $138 after earnings (below lower wing): The butterfly is worth approximately $0.15-$0.25. Close for the residual value or let it expire. Net loss: $0.55-$0.65 per share ($55-$65 per contract). The loss is small and defined — exactly the risk you accepted at entry.
Scenario C — stock rallies to $155 after earnings (above upper wing): The butterfly is worth approximately $0.05-$0.10. Close or let expire. Net loss: $0.70-$0.75 per share ($70-$75 per contract). Again, a small defined loss. The trade was wrong on direction, but the butterfly’s low cost meant the loss was minor relative to a directional bet via long calls or stock.
Frequently Asked Questions
How much does a butterfly spread cost?
A butterfly spread typically costs 15-35% of the wing width. A $5-wide butterfly costs $0.75-$1.75 per share ($75-$175 per contract). A $10-wide butterfly costs $1.50-$3.50 per share. The cost depends on implied volatility (higher IV means cheaper butterflies because the short options absorb more premium), time to expiration, and how close the centre strike is to the current stock price. Butterflies centred at the money are cheaper than those centred away from the current price.
What is the maximum profit on a butterfly spread?
Maximum profit equals the wing width minus the debit paid. On a $5-wide butterfly that costs $1.00, the maximum profit is $4.00 per share ($400 per contract). This maximum occurs only if the stock is exactly at the centre strike at expiration. In practice, most profitable butterflies are closed at 40-75% of this theoretical maximum because the stock is rarely exactly at the centre at the moment of expiration.
Is a butterfly spread bullish or bearish?
A butterfly spread is neither inherently bullish nor bearish — it is a neutral or precision-directional strategy. A butterfly centred at the current stock price is neutral (you expect the stock to stay put). A butterfly centred above the current price is moderately bullish (you expect a rally to a specific level). A butterfly centred below is moderately bearish. The directional bias comes from where you place the centre strike relative to the current price, not from the structure itself.
When should you close a butterfly spread?
Close a butterfly spread when it reaches 50-75% of its maximum theoretical profit, or when fewer than 7 days remain until expiration (unless you are specifically playing an expiration pin). The final week brings extreme gamma risk — small stock movements cause large swings in the butterfly’s value. A profitable butterfly at 10 DTE can become a losing butterfly in a single day if the stock moves $2-3 away from the centre strike.
What is the difference between a butterfly spread and an iron butterfly?
A butterfly spread uses three legs of the same option type (all calls or all puts) and is entered for a debit. An iron butterfly uses four legs with both calls and puts (a short straddle at the centre plus long wings) and is entered for a credit. The payoff at expiration is identical — same max profit, same max loss, same breakevens. The difference is structural: the debit butterfly defines max loss as the debit paid. The iron butterfly defines max loss as the wing width minus the credit received. Choose whichever has better liquidity and tighter spreads on the underlying you are trading.
FATTAIL BRIEFINGS
Get FatTail briefings in your inbox
Pick the lists you want. FOMC Alerts is selected by default.