


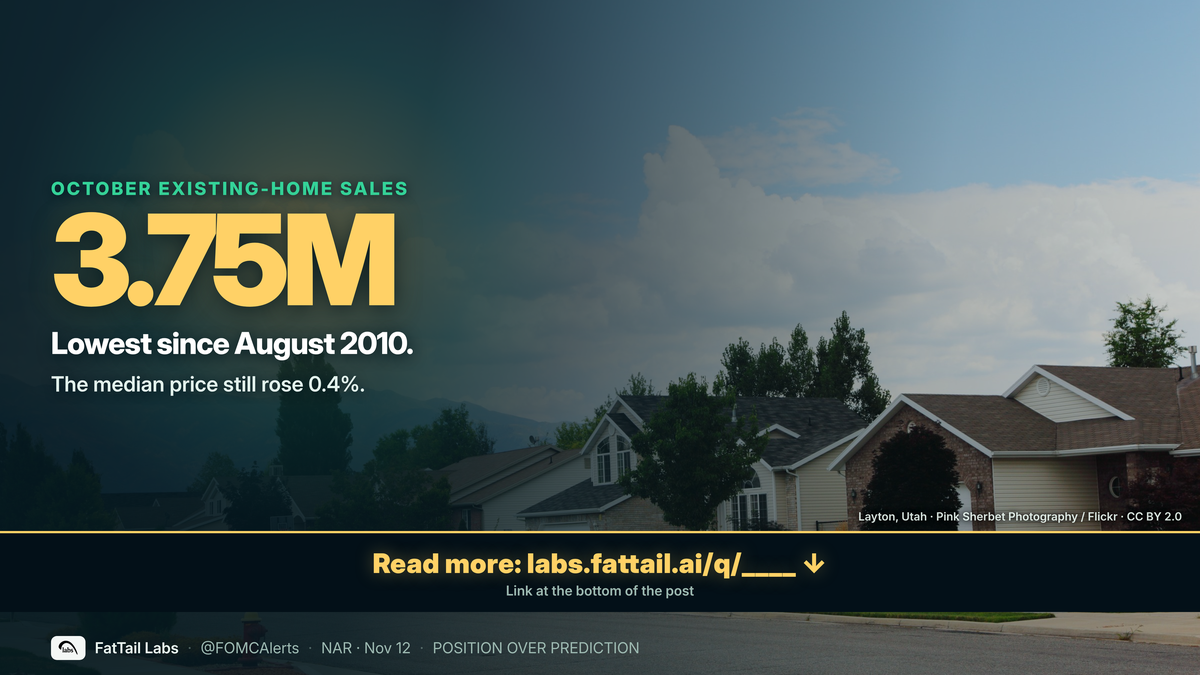
Existing home sales October 2026: 3.75 million, lowest since August 2010
The National Association of Realtors’ Existing home sales October 2026 release, out at 10:00 AM ET Thursday, showed a seasonally adjusted annual rate of 3.75 million, down 5.5% from September and 8.8% from a year earlier. NAR chief economist Lawrence Yun said sales fell to their lowest level since August 2010. The median existing-home price was $416,700, still up 0.4% from $414,900 a year earlier — the 40th straight month of year-over-year price gains, and not a record. June’s median was $442,800, and September’s was revised to $418,200. The print is in the official NAR Existing-Home Sales report.
The 5.5% monthly decline is measured from a revised September pace of 3.97 million, not the 3.99 million NAR published on Oct. 13. Inventory was 1.59 million units, up 1.3% month over month and 4.6% year over year, or 5.1 months of supply. September inventory was revised to 1.57 million and months’ supply to 4.7 (from 4.8); a year earlier, supply was 4.4 months. Third-party previews were not a single consensus: FactSet, via AP, had 3.8 million, and a Reuters poll had 3.85 million. The 3.75 million print came in below both; we are not picking a winner between those two surveys.
What the print is — and what it is not
Existing-home sales count closings of previously occupied single-family homes, townhomes, condos and co-ops drawn from MLS data, expressed as a seasonally adjusted annual rate. That is a different series from Census new-home sales, which track contracts and deposits on newly built houses. For the Federal Reserve’s Dec. 8–9 meeting, this is the last scheduled existing-home sales print that can enter the pre-meeting book. November sales are due at 10:00 AM ET on Wednesday, Dec. 9 — the morning of the decision. Housing is not the lead December input: October CPI is already out, PPI is due Friday, and PCE follows on Nov. 25. See our October CPI 2026 recap and the economic reports tracker.
NAR said the 30-year fixed mortgage averaged 7.33% in October, citing Freddie Mac, up from 6.86% in September and 6.25% a year earlier. That official monthly average is not the same figure as the weekly Primary Mortgage Market Survey. Weekly PMMS peaked at 7.40% in the weeks of Oct. 8 and Oct. 15, the first readings at or above 7.40% since Nov. 16, 2023 (7.44%). The latest weekly print, for the week of Nov. 12, is 7.11%, after 7.18% on Nov. 5. Mortgage rates price off the long end of the Treasury curve — the official 10-year par yield was 5.10% on Nov. 12 (U.S. Treasury Daily Treasury Par Yield Curve Rates, retrieved 6:26 PM ET; no Nov. 11 row, Veterans Day close; Nov. 10 was 4.98%) — not one-for-one with the 3.75–4.00% federal funds target. We are not forecasting the next PMMS print or a rate path.
Yun, in the official release, said: “Home buying is difficult when mortgage rates have climbed to their highest levels since 2000, aside from a single month in 2023. As a result, home sales fell to their lowest level since August 2010.” The Freddie Mac monthly averages we can check are October 7.33%, September 6.86%, and 6.25% a year earlier; we are not independently asserting the “single month in 2023” comparison beyond quoting him. He also said: “Based on the current underwhelming home sales pace at a time of consistent job growth, there could be sizable pent-up demand if mortgage rates decline.” That is his condition, not a FatTail forecast.
Advertisement · From FatTail Labs

Observer: train with Coach for $17/week
A six-week trial and training program built to install pro trading habits: live daily coaching, courses, a Discord trade room and the full FatTail platform.
Policy context and what it means for 0DTE
The FOMC’s current target range is 3.75–4.00%, after a 25 bp hike on Sept. 16 (12–0) and a hold on Oct. 28 (10–2, with Governors Cook and Cleveland Fed President Hammack preferring +25). The next scheduled decision is Dec. 8–9. RateWatch, FatTail’s house ZQ-method reading, shows, as of 2026-11-12 16:37:26 EST, a December hike at 100% and a hold at 0%; of that hike, +25 bp is 80.1% and +50 bp is 19.9%. January is 71.2% hike / 28.8% hold, and March is 72.0% hike / 28.0% hold. Those are single current levels with an as-of stamp, not a reaction to this housing print or to any other event. Live odds: RateWatch. Meeting calendar: December FOMC 2026.
On the tape, this is usually a second-tier 10:00 AM ET release, not a typical vol event. In our own Massive official-bar sample of 22 NAR existing-home sales dates from Jan. 24, 2025 through Oct. 13, 2026 (excluding today and the Dec. 9 print), the mean absolute S&P 500 close-to-close move was 0.71%, versus 0.68% on all 432 trading days in the same window. The print lands after the cash open, and other news can land the same day, so those figures are unconditional — not a surprise study. Last official cash close, Thursday Nov. 12: S&P 500 7,592.40, VIX 18.70, VIX1D 15.99 (Massive daily bar and open-close, retrieved 6:25 PM ET). We are not attributing the 9:30 open or any midday bounce to this release.
- Energy: A scheduled, usually low-impact housing print — useful context for the December book, not a typical 10:00 vol event.
- Premium: Let implied vol price the session; do not treat this release as if it were CPI or the Dec. 9 decision.
- Structure: Defined risk only, with max loss known before entry, especially with PPI due Friday and the FOMC three and a half weeks out.
- Plan, don’t predict: The fact is a 3.75 million pace, the lowest since August 2010, with prices still up 0.4%. Whether slower turnover changes the December path stays in the data, not in a directional bet.
Related reading: October CPI 2026 · Household debt Q3 2026 · RateWatch · Economic reports tracker · FOMC meeting schedule 2026 · FOMC Alerts hub
Sources
- Existing-Home Sales Decreased 5.5% in October, According to NAR Report (National Association of Realtors, 2026-11-12)
- Existing-Home Sales (statistics page) (National Association of Realtors, 2026-11-12)
- Freddie Mac Primary Mortgage Market Survey history (Freddie Mac, 2026-11-12)
- Daily Treasury Par Yield Curve Rates (U.S. Department of the Treasury, 2026-11-12)
- FRED DGS10, daily 10-year Treasury yield (Federal Reserve Bank of St. Louis / U.S. Treasury, 2026-11-10)
- Federal Reserve issues FOMC statement (Sept. 16, 2026) (Board of Governors of the Federal Reserve System, 2026-09-16)
- Federal Reserve issues FOMC statement (Oct. 28, 2026) (Board of Governors of the Federal Reserve System, 2026-10-28)
- RateWatch odds_current.json (public file) (FatTail RateWatch, 2026-11-12)
- Massive official Nov 12 cash closes (I:SPX, I:VIX, I:VIX1D) (Massive, 2026-11-12)
FATTAIL BRIEFINGS
Get FatTail briefings in your inbox
Pick the lists you want. FOMC Alerts is selected by default.