


FOMC Alerts · October 30, 2026
Why is gold falling when inflation is running hot? U.S. consumer prices rose 3.7% in the year to September (BLS), and the Fed’s preferred gauge, the PCE price index, rose 3.6% (BEA). Those are the kind of numbers that are supposed to help an inflation hedge. Instead, COMEX gold futures closed at $4,031.40 on Thursday, Oct. 29. That is 24.2% below the Jan. 29 close of $5,318.40, the late-January peak, and 7.1% lower for the year (COMEX gold futures (GC=F) via Yahoo Finance). The lowest close of the slide so far is $4,007.90 on Oct. 23, the lowest since July 16. Early Friday, futures traded near $3,962 at 9:03 AM ET, below that July 16 close of $3,992.10. That’s an intraday price, not a close.
The short answer has two parts. Over 2026, the slide lines up with one thing: the real yield on Treasuries, the return investors get after inflation. Week to week, it often doesn’t. In the week to Oct. 23, real yields fell and gold fell anyway, and Fed week was mixed. Both parts matter if you trade around the Fed.
Why is gold falling? The chain in four steps
1. Hot inflation keeps the Fed leaning toward hikes. Headline CPI was 3.7% y/y in September and core was 2.6% (BLS). Core PCE ran at 3.1% (BEA). The Fed raised its target range a quarter point on Sept. 16, to 3.75%–4.00%, and held it there on Oct. 28 in a 10–2 vote. Lisa Cook and Beth Hammack dissented because they wanted another quarter-point hike (Federal Reserve); we covered the meeting in our Oct. 28 decision recap. As of 11:11 AM ET Friday (Oct. 30), our calculation from fed funds futures using CME’s method put the odds of a hike at the Dec. 9 meeting at 76.3%, versus 77.3% at Thursday’s 4:37 PM ET close; it read 68.4% at 8:55 AM ET (CME 30-day fed funds futures, real-time quotes). These reads can swing several points on a half-tick move in fed funds futures. For how that math works, see our guide to reading Fed rate odds, and track the live read on RateWatch.
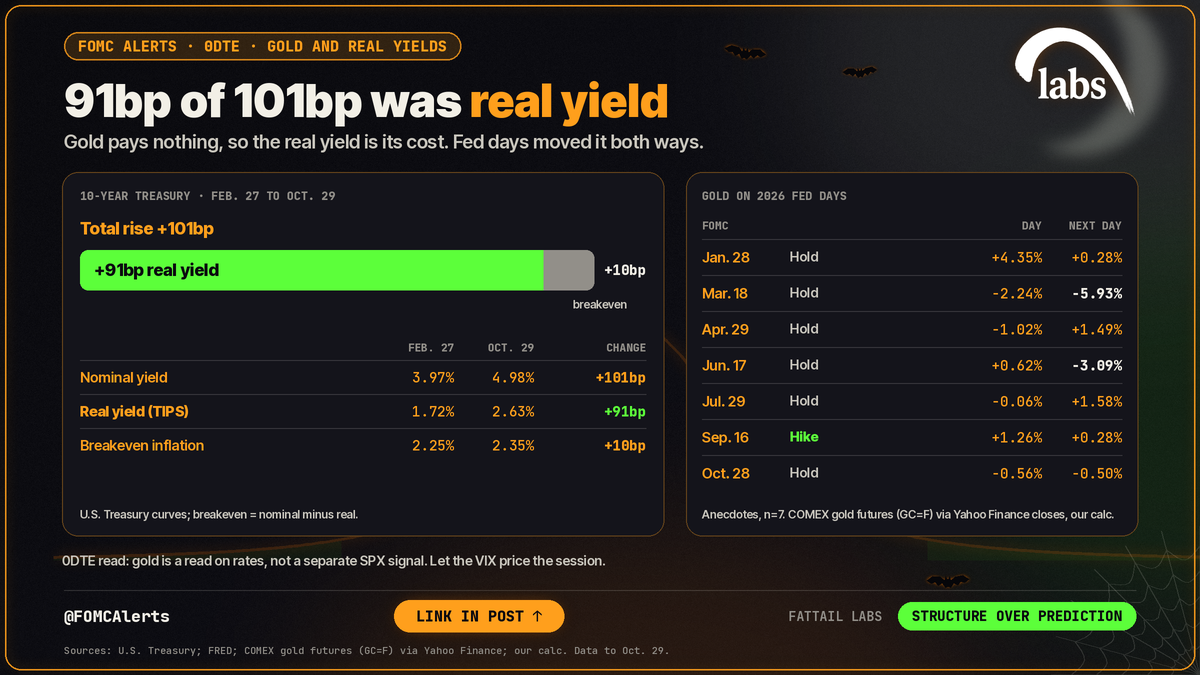
2. The rise in yields is almost all real yield. A nominal Treasury yield splits into two pieces: the real yield (what TIPS pay) and the breakeven (the inflation the market expects). From Feb. 27 to Oct. 29, the 10-year yield rose 101bp. Of that, 91bp came from the real yield and just 10bp from the breakeven (U.S. Treasury).
| 10-year Treasury | Feb. 27 | Oct. 29 | Change |
|---|---|---|---|
| Nominal yield | 3.97% | 4.98% | +101bp |
| Real yield (TIPS) | 1.72% | 2.63% | +91bp |
| Breakeven inflation | 2.25% | 2.35% | +10bp |
Source: U.S. Treasury daily par and par real yield curves (10-year). Breakeven = nominal minus real, which matches FRED’s T10YIE (2.35% on Oct. 29). Rounded, so the rows add exactly here but may not on other dates.
Long-run inflation expectations barely moved. The 5-year, 5-year forward breakeven was 2.23% on Oct. 29 against 2.10% on Feb. 27 (FRED). The bond market doesn’t think inflation is out of control. It thinks the Fed will keep real rates high to stop it. Oil is part of that story; we covered it in how oil prices affect interest rates.
3. Gold pays nothing, so real yield is its cost. Holding gold means giving up the real yield on a Treasury. The 10-year TIPS yield was 2.63% on Oct. 29 (U.S. Treasury), against 1.72% on Feb. 27. Hamad Hussain, climate and commodities economist at Capital Economics, put the link plainly: “The rise in oil prices could result in real interest rates remaining higher for longer, which would reduce the relative attractiveness of investing in and holding gold” (Reuters, Oct. 23, via CNBC).
4. The data agree, loosely. In our 2026 sample through Oct. 29 (43 weeks, the last one partial), weekly changes in gold had a correlation of −0.40 with changes in the 10-year real yield and −0.05 with changes in the breakeven. On average, each 1bp rise in the real yield came with a 0.17% drop in gold. That’s description, not causation. It’s a partial year of continuous front-month futures, and a correlation of −0.40 leaves most of the weekly moves unexplained.
Where the chain breaks: the week to Oct. 23
If real yields were the whole story, gold should have had a decent week. It didn’t. The 10-year real yield fell 8bp, from 2.74% on Oct. 16 to 2.66% on Oct. 23, while gold fell 4.14%. On Oct. 22 alone, the 10-year real yield dropped 12bp and the 5-year 22bp, and gold still lost 2.16%. We broke down that bond rally in why Treasury yields are falling.
Reuters linked the selling to oil and Fed-rate concerns (via CNBC), and Bloomberg’s Oct. 23 headline read “Gold Falls to July Low as Inflation Concerns Weigh Before Fed.” Reuters also reported that silver fell to its lowest since November 2025. We couldn’t verify a single driver from the data. The dollar doesn’t explain it: the Fed’s broad dollar index, now updated through Oct. 23, was almost flat that week, down 0.07% (FRED). Treat any one-line explanation of that week with suspicion, including ours.
Advertisement · From FatTail Labs

Observer: train with Coach for $17/week
A six-week trial and training program built to install pro trading habits: live daily coaching, courses, a Discord trade room and the full FatTail platform.
Fed week and PCE: did the chain hold?
Partly. On Oct. 28, the day of the hold, the 10-year real yield rose 3bp to 2.67% and gold fell 0.56%. That fits the chain. Thursday didn’t. After the September PCE and Q3 GDP reports, the real yield fell 4bp to 2.63%, and gold still slipped 0.50% (U.S. Treasury; COMEX gold futures (GC=F) via Yahoo Finance). Over the whole stretch from Oct. 23 to Oct. 29, the real yield eased 3bp and gold gained 0.59%. That’s the right direction, but the moves were small. Fed week neither clearly fit the chain nor broke it. Real yields still explain the year, not every week.
Quick tutorial: what PCE and GDP are, and why they move rates
- What they are: both come from the Bureau of Economic Analysis at 8:30 AM ET. The PCE price index tracks what consumers pay across their spending. Core PCE leaves out food and energy, and it is the Fed’s preferred inflation gauge. GDP is the broadest score of U.S. output, and the advance estimate is the first of three.
- How they inject energy: a surprise in either one can reprice rate odds within minutes. That moves Treasury yields, real yields included, plus the dollar and index futures before the cash open.
- How they feed the rate decision: PCE tells the FOMC whether inflation is heading toward its 2% goal. GDP tells it whether the economy can absorb current policy. Hot prices plus strong growth argue for holding high or hiking. Soft readings argue for patience.
September’s reports: PCE prices rose 0.5% m/m and 3.6% y/y, core rose 0.3% m/m and 3.1% y/y (BEA), and real GDP grew at a 3.4% annual rate in Q3, up from 2.2% in Q2 (BEA). We covered the print in our September PCE breakdown.
Is gold still an inflation hedge?
Over long stretches, maybe. Over 2026, the evidence says gold has behaved more like a rate-sensitive asset than an inflation hedge. Its weekly link to breakevens was close to zero, and its link to real yields was clearly negative. Barron’s ran a piece on Oct. 23 under the headline “Why Gold Is Losing Its Status as an Inflation Hedge.”
Tim Pickering, president and CIO of Auspice Capital Advisors, told Kitco that gold’s weakness as a hedge is that it can turn rate-sensitive exactly when consumers face rising prices. He pointed to 2020–2022, when gold struggled even as U.S. inflation hit a four-decade high of 9%, Kitco reported. His summary: “Gold’s not a panacea. It’s just a diversifier” (Kitco News).
Gold on Fed days in 2026
Gold has moved around FOMC decisions this year, but not in one direction. Seven meetings make anecdotes, not a pattern:
| FOMC day | Decision | Gold that day | Gold next day |
|---|---|---|---|
| Jan. 28 | Hold | +4.35% | +0.28% |
| Mar. 18 | Hold | −2.24% | −5.93% |
| Apr. 29 | Hold | −1.02% | +1.49% |
| Jun. 17 | Hold | +0.62% | −3.09% |
| Jul. 29 | Hold | −0.06% | +1.58% |
| Sep. 16 | Hike | +1.26% | +0.28% |
| Oct. 28 | Hold | −0.56% | −0.50% |
Source: our calculation from COMEX gold futures (GC=F) via Yahoo Finance daily closes. The two largest one-day drops in the table still came the day after the decision (Mar. 19 and Jun. 18), not on the day. The Oct. 28 hold brought small moves on both days.
What it means for 0DTE
- Energy: gold isn’t the event. The scheduled event risk is the Fed and the data that move real yields, like this week’s PCE and GDP. Gold’s slide is a read on rates, not a separate signal for SPX.
- Premium: let the VIX price the session. A gold move doesn’t make SPX options cheap or expensive by itself.
- Structure: on days when real yields jump, rate-sensitive assets can move together. Size for gaps and keep risk defined.
- Plan: map scenarios, don’t predict them. If real yields rise and gold falls, that’s the 2026 pattern. If gold falls while real yields fall, as in the week to Oct. 23 and again on PCE day, something else is driving it, and the chain is a poor guide for the session.
Related reading: How oil prices affect interest rates · Why are Treasury yields falling? · How to read Fed rate odds · FOMC Alerts Hub
Sources
- Gold Dec 26 futures (GC=F) historical data (COMEX gold futures (GC=F) via Yahoo Finance, 2026-10-30)
- 30-Day Federal Funds futures (CME Group via Massive (real-time), 2026-10-30)
- Daily Treasury Par Real Yield Curve Rates, 2026 (U.S. Treasury, 2026-10-29)
- Daily Treasury Par Yield Curve Rates, 2026 (U.S. Treasury, 2026-10-29)
- Market Yield on U.S. Treasury Securities at 10-Year (DGS10) (FRED, 2026-10-28)
- 10-Year TIPS yield (DFII10) (FRED, 2026-10-28)
- 5-Year TIPS yield (DFII5) (FRED, 2026-10-22)
- 10-Year Breakeven Inflation Rate (T10YIE) (FRED, 2026-10-29)
- 5-Year, 5-Year Forward Inflation Expectation Rate (T5YIFR) (FRED, 2026-10-29)
- Nominal Broad U.S. Dollar Index (DTWEXBGS) (FRED, 2026-10-23)
- Consumer Price Index, September 2026 (BLS, 2026-10-14)
- Personal Income and Outlays, September 2026 (BEA, 2026-10-29)
- Gross Domestic Product, Third Quarter 2026 (Advance Estimate) (BEA, 2026-10-29)
- Federal Reserve issues FOMC statement (Federal Reserve, 2026-10-28)
- October 2026 calendar (Federal Reserve, 2026-10-23)
- Gold set for steep weekly loss as rising oil prices bolster Fed rate hike bets (Reuters) (Reuters via CNBC, 2026-10-23)
- Gold and silver are not the best inflation hedges; investors should diversify into the commodity supercycle – Auspice Capital (Kitco News, 2026-10-22)
- Why Gold Is Losing Its Status as an Inflation Hedge (Barron's (headline only), 2026-10-23)
Trade it with structure
Observer is a six-week trial and training program: train with Coach for $17/week. You get everything a full coaching member gets, every week, and the six weeks are designed to install pro trading habits: courses on strategy, process and risk management, live daily coaching, a Discord trade room with hundreds of experienced traders, and the platform (heatmap, GEX tools, risk graph, position analyzer and journal). Start Observer.
Educational content, not investment advice. Options involve risk and are not suitable for all investors.
FATTAIL BRIEFINGS
Get FatTail briefings in your inbox
Pick the lists you want. FOMC Alerts is selected by default.