


FOMC Alerts · October 29, 2026
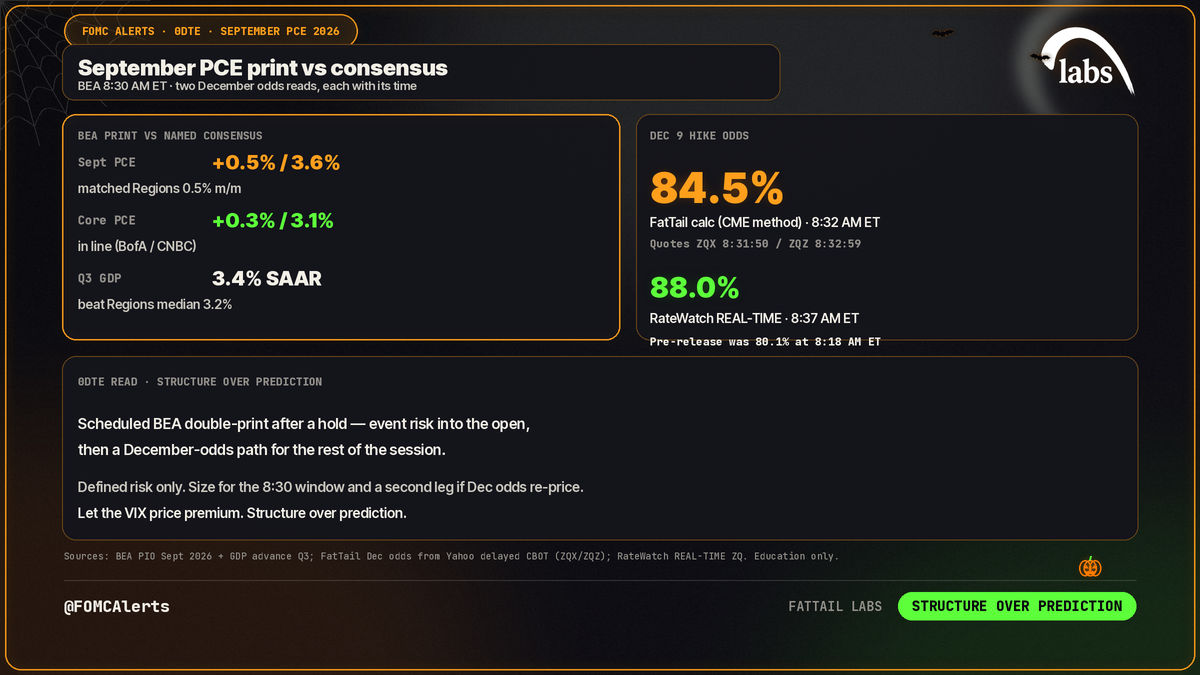
PCE inflation September 2026, in short: the Bureau of Economic Analysis released Personal Income and Outlays and the Q3 GDP advance at 8:30 AM ET — the first major print after the Oct 28 10–2 hold. Headline PCE rose 0.5% month-over-month / 3.6% year-over-year; core PCE rose 0.3% / 3.1%; real GDP rose at a 3.4% annual rate. That combination kept a December hike priced high on our desk read. This is the data-led reaction. The December calendar and SEP setup live on a sibling post that publishes later today — we do not redo that preview here.
What did September PCE 2026 and Q3 GDP print?
Per the BEA Personal Income and Outlays release (pulled ~8:38 AM ET):
- September PCE price index: +0.5% m/m / +3.6% y/y (August: +0.3% / +3.4%).
- September core PCE (ex food and energy): +0.3% m/m / +3.1% y/y. The BEA table now shows August core m/m revised to 0.3% (was 0.2%); August core y/y was 3.0%.
- Personal income: +0.2% m/m. Nominal PCE spending: +0.5% m/m. Personal saving rate: 3.8%.
Per the BEA GDP advance estimate: Q3 real GDP rose at a 3.4% SAAR (Q2 was 2.2%). The GDP implicit price deflator was 2.2% SAAR (Q2 6.1%) — labeled as the implicit price deflator from BEA’s hist workbook, not a Table 1.1.7 chain-type read. Quarterly PCE prices in the GDP release were 2.1%, core PCE 2.5%; gross domestic purchases prices 3.0%.
Oct 28 was Warsh’s fourth meeting as chair (chaired since May 22, 2026) — a 10–2 hold at 3.75%–4.00% (Fed decision October 28, 2026), with Cook and Hammack preferring +25 bp. Today’s print is the first hard inflation and growth data after that vote.
How did the print compare with named consensus?
Attribute each forecast to its source — they are not the same survey:
- Q3 GDP 3.4%: beat the Regions survey median of 3.2% (range 2.5–4.1); above the CNBC/Dow Jones estimate of 3.1%; below BofA’s 3.5% as carried secondhand by TheStreet.
- Sept PCE 0.5% m/m / 3.6% y/y: matched the Regions survey median of 0.5% m/m. CNBC reported the month in line with Dow Jones and the year 0.1 pp below its annual consensus.
- Sept core PCE 0.3% / 3.1%: matched BofA’s call (via TheStreet) and what CNBC described as in line with consensus. Regions’ own call was 0.4% / 3.1% — not the survey median.
- Income (+0.2%) undershot CNBC’s 0.3% forecast and Regions’ own 0.4%. Spending (+0.5%) undershot CNBC’s 0.6% forecast.
Read as a package: hot on the PCE year rate, in line on the month and on core, with a GDP beat versus the Regions median. Structure the path — do not treat any single survey as “the” consensus.
Why is core PCE at 3.1% above core CPI near 2.6%?
Core PCE is 3.1% y/y (BEA). Core CPI is about 2.6% y/y for September: FRED’s CPILFESL index (338.896 / 330.418) implies 2.57%, and the BLS NSA series CUUR0000SA0L1E (339.287 / 330.804) implies 2.56%. We did not pull a BLS HTML screenshot this turn (release page returned HTTP 403), so the CPI figure is index-implied with FRED/API citation.
That ~0.5 pp gap is not a mystery category we invent for this month. BEA FAQ 555 groups PCE–CPI differences into four effects:
- Formula — PCE uses a Fisher-Ideal index; CPI uses a modified Laspeyres formula.
- Weight — different relative importance of the underlying commodities.
- Scope — PCE covers spending by and on behalf of the personal sector (households and NPISHs); CPI covers out-of-pocket spending by urban households.
- Other — seasonal adjustment differences, price differences, residual.
BEA’s learning-center note also stresses that PCE reflects substitution and is revised, and that the Fed relies on PCE for policy. We did not pull BEA Table 9.1U for this month, so we do not claim which of the four categories drove September’s gap. For the supply-versus-demand framing of core PCE, see our morning piece on supply vs demand driven inflation.
Advertisement · From FatTail Labs

Observer: train with Coach for $17/week
A six-week trial and training program built to install pro trading habits: live daily coaching, courses, a Discord trade room and the full FatTail platform.
What did the print do to December hike odds?
Every desk figure below is our calculation from fed funds futures using CME’s method (Yahoo delayed CBOT quotes), with true as-of times. RateWatch is a separately labeled REAL-TIME read — never blend the two runs into one number.
| Read (ET) | Dec 9 hike % | Series |
|---|---|---|
| Wed Oct 28 ~2:00–2:05 PM (pulled 2:16) | 87.4% | Our CME-method (Yahoo delayed) |
| Wed Oct 28 evening (pulled ~9:34 PM) | 84.5% | Our CME-method (Yahoo delayed) |
| Thu Oct 29 8:18:42 AM | 80.1% | RateWatch REAL-TIME ZQ (pre-release) |
| Thu quotes 8:31:50 / 8:32:59 AM (pulled 8:45) | 84.5% (range 78.9–90.2% on ±0.005 grid) | Our CME-method (Yahoo delayed; ZQX26 96.12 / ZQZ26 95.97) |
| Thu Oct 29 8:37:28 AM | 88.0% | RateWatch REAL-TIME ZQ (post-data) |
| Thu Oct 29 9:46 AM | 74.2% | RateWatch REAL-TIME ZQ |
| Thu Oct 29 11:13:50 AM | 81.1% | RateWatch REAL-TIME ZQ |
After the 8:30 data, our post-print desk read is 84.5% — same level as Wednesday evening, below the Wednesday afternoon 87.4%. RateWatch’s separate post-data stamp is 88.0% at 8:37:28 AM ET (pre-release was 80.1% at 8:18:42 AM ET). The ~3.5 pp desk-versus-RateWatch gap is quote timing and rounding inside the same CME-method family: RateWatch uses Massive REAL-TIME last trades (ZQZ6 last 95.97 at 8:36:41); our Yahoo path is delayed with a two-decimal display whose ±0.005 sensitivity band (78.9–90.2) brackets RateWatch’s 88.0. Present both. Do not collapse them. Later in the session RateWatch swung: 74.2% at 9:46 AM ET, then 81.1% at 11:13:50 AM ET (hold 18.9%). The path after the print matters more than any single stamp.
Chair Warsh, as quoted by CNBC in its Oct 29 PCE/GDP article (not yet matched to a Fed Q&A transcript): “The period right in front of us is information rich. There is a lot that’s happening in the world. My colleagues and I are keen to take notice of it,”
What it means for 0DTE
- Energy: A scheduled BEA double-print the morning after a hold — classic event risk into the open, then a December-odds path for the rest of the session. Not commentary noise.
- Premium: SPX 7,698.23, −45.7 (−0.59%) as of 9:35:09 AM ET (Massive). VIX 17.28 vs Wed close 16.91 as of 9:35:01 AM ET (Massive). Pre-open VIX was 16.95 at 9:00:16 AM ET (Massive). Map the structure of the window; do not claim implied vol “has to” crush after the print.
- Structure: Defined risk only. The 8:30 gap is done; size for a second leg if Dec odds keep re-pricing into the afternoon. Max loss known before entry.
- Plan, don’t predict: Script a hike-priced Dec path and a hold-priced Dec path from today’s stamps — don’t bet which print “forces” Dec 9. Base rates after FOMC (our patterns file, sample through Oct 27): median |SPX| next-day change 0.58% vs 0.49% other days; VIX day-after median −0.11 pts, lower on 57% of days (n=93, 2015+). Holds since 2015: median |SPX| day 0.47%, intraday range 1.09% (n=63). Base rates, not a call.
Related reading: Fed decision October 28, 2026 · FOMC meeting schedule 2026 · Supply vs demand driven inflation · Q3 GDP 2026 preview · IV crush and options · FOMC Alerts hub
Sources
- Personal Income and Outlays, September 2026 (U.S. Bureau of Economic Analysis, 2026-10-29)
- Gross Domestic Product, Third Quarter 2026 (Advance Estimate) (U.S. Bureau of Economic Analysis, 2026-10-29)
- PCE inflation report September 2026 (CNBC, 2026-10-29)
- What accounts for the differences in the PCE price index and the Consumer Price Index? (BEA FAQ, 2010-11-03)
- Prices & Inflation (learning center) (BEA, fetched 2026-10-29)
- CPILFESL — Consumer Price Index Less Food and Energy (FRED / BLS, Sep 2026 obs; updated 2026-10-14)
- ZQZ26.CBT (delayed CBOT quote page used for desk CME-method odds) (Yahoo Finance (delayed), 2026-10-29)
- Breaking: US Headline PCE rose by 3.6% YoY in September (FXStreet, 2026-10-29)
Trade it with structure
Observer is a six-week trial and training program: train with Coach for $17/week. You get everything a full coaching member gets, every week, and the six weeks are designed to install pro trading habits: courses on strategy, process and risk management, live daily coaching, a Discord trade room with hundreds of experienced traders, and the platform (heatmap, GEX tools, risk graph, position analyzer and journal). Start Observer.
Educational content, not investment advice. Options involve risk and are not suitable for all investors.
FATTAIL BRIEFINGS
Get FatTail briefings in your inbox
Pick the lists you want. FOMC Alerts is selected by default.