


FOMC Alerts · October 28, 2026
There is no Fed dot plot today. The Fed publishes its Summary of Economic Projections, dots included, at four meetings a year, and the Oct 27-28 meeting isn’t one of them (Federal Reserve). The statement lands at 2:00 PM ET and Chair Kevin Warsh speaks at 2:30 PM ET. The next dots come Wed Dec 9. Until then, September’s dots are the latest, and they lean toward more hikes.
Is there a Fed dot plot at the October FOMC meeting?
No. In 2026 the projection meetings are Mar 17-18, Jun 16-17, Sep 15-16 and Dec 8-9, marked with an asterisk on the Fed’s calendar. January, April, July and this week’s meeting carry no projections. Every 2026 meeting has a press conference, so today still has one; only the projections are missing. Our FOMC meeting schedule 2026 shows which meetings carry them.
What did the September Fed dot plot show?
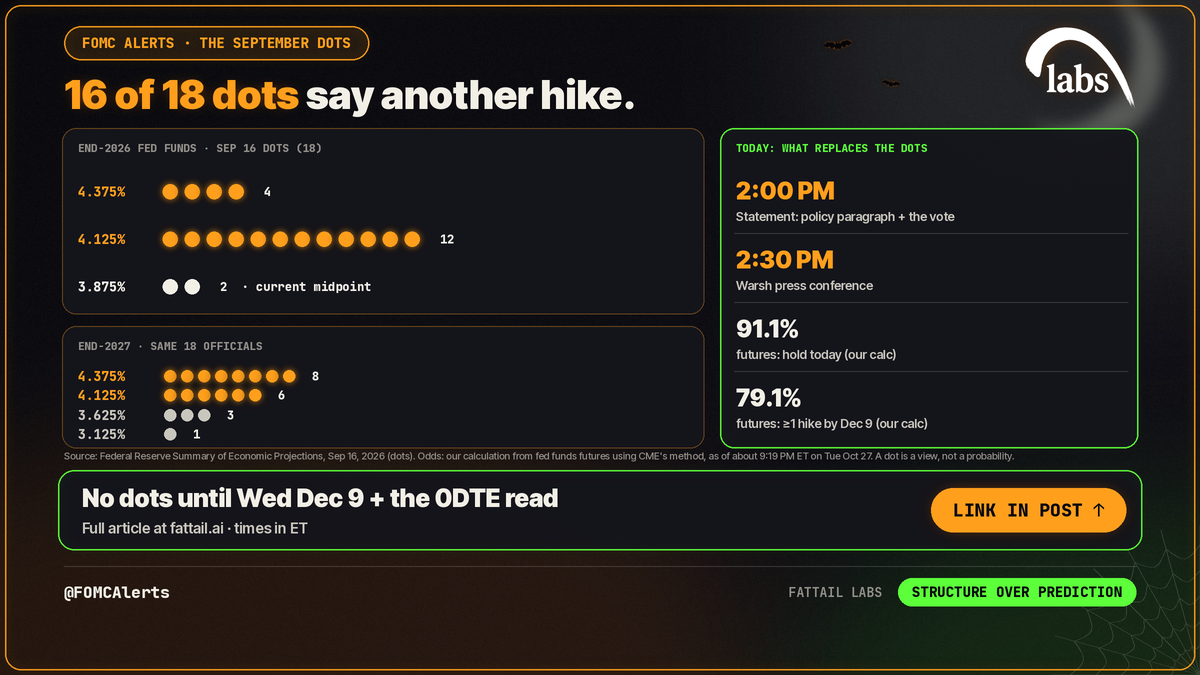
Eighteen participants submitted projections on Sep 16, the day the Fed hiked to 3.75%-4.00% (Federal Reserve). The median funds rate was 4.1% for the end of 2026, 4.1% for 2027, 3.9% for 2028, 3.6% for 2029 and 3.2% for the longer run. In June the 2026 median was 3.8%, 2027 was 3.6% and the longer run 3.1%.
- 2026: 12 dots at 4.125% and 4 at 4.375%, so 16 of 18 saw at least one more hike this year and 4 of them saw two. The other 2 sat at 3.875%, the current midpoint.
- 2027: 8 at 4.375%, 6 at 4.125%, 3 at 3.625% and 1 at 3.125%.
- Inflation and jobs: median core PCE inflation of 3.4% for 2026 (3.3% in June), headline PCE 3.7%, unemployment 4.1% (4.3% in June) and GDP growth 2.3% (2.2% in June).
- Growth risks: no participant saw them tilted to the downside, 13 saw them balanced and 5 saw upside risk. In June the split was 5, 10 and 3.
Why didn’t Warsh submit a dot?
The chair hasn’t put in a dot at either projection meeting since he took over. At his June press conference he said: “I did not submit a, a dot. For me, it’s not helpful in the conduct of policy.” (Fed transcript, June 17). In September he said in his opening statement that “as in June, I have not offered a projection of my own.” (Fed transcript, Sep 16).
He hasn’t asked colleagues to stop. In June he said he had encouraged them to keep submitting, and he described their projections as written in pencil, the kind with big erasers. He also said he wouldn’t be surprised to see a new communications framework, including changes to the projections, by year-end. A communications task force led by Peter R. Fisher, Arminio Fraga and Mervyn King is doing that review (Federal Reserve). No change to the December projections has been announced. Outside the Fed, one option being discussed is a market-implied rate path, the Bank of England and ECB approach (Andersen Institute). That’s outside commentary, not a Fed plan.
Advertisement · From FatTail Labs

Observer: train with Coach for $17/week
A six-week trial and training program built to install pro trading habits: live daily coaching, courses, a Discord trade room and the full FatTail platform.
Fed dot plot vs fed funds futures: what replaces the dots today?
Three things carry the signal at a meeting without dots:
- The 2:00 PM statement. Forward guidance was dropped in June, so changes in the policy paragraph and the vote, including any dissents, are the message.
- The 2:30 PM press conference. It’s the only scheduled forward-looking channel left, and Warsh has said giving forward guidance isn’t his business.
- Market odds. Our calculation from fed funds futures using CME’s method, as of about 9:19 PM ET on Tue Oct 27, puts a hold today at 91.1% and at least one hike by Dec 9 at 79.1%. Here’s how to read Fed rate odds.
September’s dots had 16 of 18 participants, or 89%, expecting another hike this year. Futures say 79.1% for at least one hike by Dec 9. They aren’t the same measure: a dot is one official’s view of the appropriate path, not a probability, so compare them with care.
How does SPX move on FOMC days without a dot plot?
Our calculation covers scheduled FOMC days from January 2019 to September 2026, all with a press conference, using daily closes:
| FOMC days | n | Median abs SPX move | Median SPX range | Closed 1%+ | VIX fell |
|---|---|---|---|---|---|
| No dots (non-SEP) | 31 | 0.74% | 1.17% | 45.2% | 58.1% |
| With dots (SEP) | 30 | 0.64% | 1.27% | 33.3% | 56.7% |
| No dots, 2+ dissents | 7 | 0.13% | 0.94% | 28.6% | 28.6% |
| No dots, 0-1 dissents | 24 | 0.90% | 1.25% | 50.0% | 66.7% |
Days without dots haven’t been calmer for stocks. The median close-to-close move was larger, and more of them closed 1% or more. The dots do move the 2-year more often: it moved 5bp or more on 60.0% of projection days vs 45.2% of the others. This year has been different in one way: the VIX didn’t fall on any of the six 2026 FOMC days (it rose on five and was flat on Jan 28). Small groups, daily closes only. For base rates on non-SEP holds, see Fed meeting this week.
What does no Fed dot plot mean for 0DTE today?
- Energy: No dots doesn’t mean no energy. FOMC is an energy input, and today it comes through the statement wording at 2:00 PM and Warsh’s answers at 2:30 PM.
- Premium: Let the VIX price premium and check the SPX expected move before entry. Don’t discount the move just because there’s no projection release.
- Structure: Defined risk, max loss known before entry. For a classic OTM butterfly, FatTail sizes width by VIX regime: ZombieLand (under 17) 20-30 points on SPX/ES, Goldilocks 1 (17-24.5) 30-40, Goldilocks 2 (24.5-32) 40-50, Chaos (above 32) 50+, at a debit of 5-10% of the width.
- Plan, don’t predict: Write down both cases before 2:00: the statement and presser lean toward a December hike, or they lean away from it. We aren’t calling which. Our guide to planning market scenarios for 0DTE SPX walks through the process. Capital preservation first: size so being wrong is survivable.
When is the next Fed dot plot?
The next FOMC meeting is Dec 8-9, and it’s a projection meeting: the next Fed dot plot comes at 2:00 PM ET on Wed Dec 9. Before then, Q3 GDP and September PCE land Thursday, Oct 29 at 8:30 AM ET. All the dates are in our FOMC meeting schedule 2026, and every update is in the FOMC Alerts hub.
Related reading: Fed meeting this week · Fed funds futures probability · How to plan market scenarios for 0DTE SPX · All FOMC Alerts coverage
Sources
- Meeting calendars and information (Federal Reserve Board, 2026-10-26)
- Summary of Economic Projections, September 16, 2026 (Federal Reserve Board, 2026-09-16)
- Transcript of Chair Warsh's Press Conference, June 17, 2026 (Federal Reserve Board, 2026-06-17)
- Transcript of Chair Warsh's Press Conference, September 16, 2026 (Federal Reserve Board, 2026-09-16)
- Chairman's Task Forces: Communications (Federal Reserve Board, 2026-07-09)
- Choosing the Fed's Dot Plot Replacement (Andersen Institute, 2026)
Trade it with structure
Observer is a six-week trial and training program: train with Coach for $17/week. You get everything a full coaching member gets, every week, and the six weeks are designed to install pro trading habits: courses on strategy, process and risk management, live daily coaching, a Discord trade room with hundreds of experienced traders, and the platform (heatmap, GEX tools, risk graph, position analyzer and journal). Start Observer.
Educational content, not investment advice. Options involve risk and are not suitable for all investors.
FATTAIL BRIEFINGS
Get FatTail briefings in your inbox
Pick the lists you want. FOMC Alerts is selected by default.