


FOMC Alerts · October 28, 2026
FOMC expected move, in short: on scheduled Fed decision days in our Feb 2023–Oct 2026 sample, SPX closed beyond 1× the prior-day VIX expected move 41.4% of the time — versus 24.1% on non-FOMC days. That is our calculation from Massive SPX/VIX daily bars (n=29 FOMC days). This is a different cut from FatTail’s broader 12–30% blowout base rate: close-to-close moves beyond 1× the prior-day VIX expected move, on a small sample of 29 Fed days — so it does not replace or contradict that band. Oct 28 is the hook, not a forecast: statement at 2:00 PM ET, Warsh press conference at 2:30, no SEP. This piece owns that FOMC-day scorecard; the evergreen formula lives on our SPX expected move page, and this week’s forward map is on FOMC implied move.
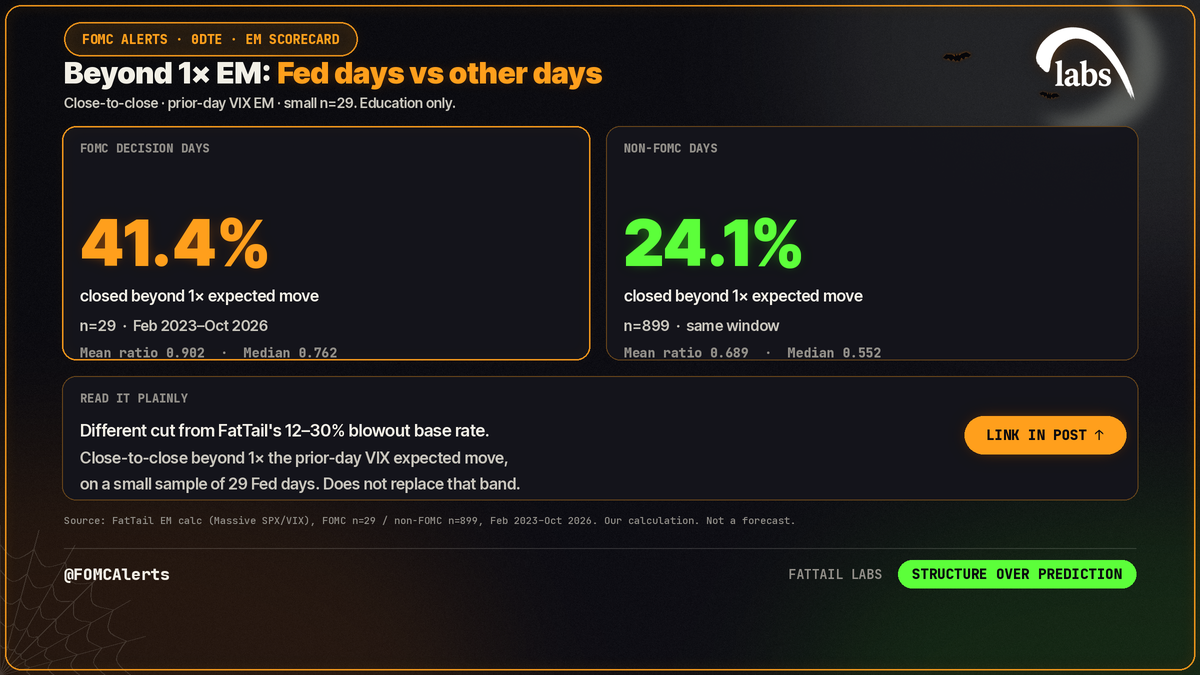
How often do FOMC days overshoot the expected move?
Close-to-close |Δ| divided by the prior-day expected move, same window for both sets:
| Set | n | % actual > 1× EM | Mean ratio | Median ratio |
|---|---|---|---|---|
| FOMC decision day | 29 | 41.4% | 0.902 | 0.762 |
| Non-FOMC | 899 | 24.1% | 0.689 | 0.552 |
| All days | 928 | 24.7% | 0.695 | 0.555 |
Derived on FOMC days only: 58.6% finished inside 1× EM (17 of 29). Overshoot tiers: >1.25× on 31.0% (9/29), >1.5× on 17.2% (5/29), >2× on 10.3% (3/29). Intraday high−low / EM is a different cut — >1× on 82.8% of FOMC days — and should not be mixed with the close-to-close rates above.
Honest limits: n=29 is small; do not over-read. The window starts Feb 15, 2023 (Massive returned no bars before Feb 14, 2023), so this sample covers Feb 2023–Oct 2026, not five full years. Median FOMC ratio 0.762 still says most Fed days finish inside the priced range; the rate of overshoot is what separates FOMC from other days (~1.7× as frequent in this window).
How is the FOMC-day expected move calculated?
Method: prior_close_SPX × (prior_close_VIX / 100) × √(1/365) — a baseline one-day expected move using the prior VIX close as the IV proxy. Actual move is |close − prior_close| in SPX points. Full formula walkthrough: how expected move is calculated. Every percentage in this article is our calculation from Massive SPX and VIX daily bars, run Oct 27, 2026.
Advertisement · From FatTail Labs

Observer: train with Coach for $17/week
A six-week trial and training program built to install pro trading habits: live daily coaching, courses, a Discord trade room and the full FatTail platform.
Which FOMC days blew past the priced range?
Largest close-to-close misses by ratio in the pack (top six):
| Date | Prior VIX | EM (pts) | Actual |Δ| | Ratio |
|---|---|---|---|---|
| 2024-12-18 | 15.87 | 50.3 | 178.4 | 3.55 |
| 2024-01-31 | 13.31 | 34.3 | 79.3 | 2.31 |
| 2023-12-13 | 12.07 | 29.3 | 63.4 | 2.16 |
| 2024-07-31 | 17.69 | 50.3 | 85.9 | 1.71 |
| 2026-07-29 | 18.21 | 70.8 | 112.6 | 1.59 |
| 2023-03-22 | 21.38 | 44.8 | 65.9 | 1.47 |
Three of the top six arrived with prior VIX in ZombieLand (below 17). That is description, not a rule that calm VIX “guarantees” containment.
What does the FOMC expected move scorecard mean for Oct 28 0DTE?
Wed Oct 28 is a no-SEP meeting — Kevin Warsh’s fourth as chair (chair since May 22, 2026), not his first. The range into the meeting is 3.75–4.00% after the Sep 16 +25 bp hike (12–0). We are not predicting whether today lands inside EM. Read the priced move; history in this window says FOMC overshoots have been nearly 1.7× as frequent as non-FOMC overshoots.
Pricing context only — our calculation from fed funds futures using CME’s method, from a fed funds futures snapshot at about 9:19 PM ET on Tue Oct 27: a Wednesday hold near 91.1% and at least one hike by the Dec 9 decision near 79.1%.
For IV after the event, see our published base rates on VIX term structure: across 93 Fed decisions since 2015, VIX closed lower 54.8% of the time, about as often as on any other day, and it closed lower on none of 2026’s six Fed days so far. IV crush is a tendency, not a rule.
- Energy: Scheduled event risk at 2:00 and 2:30 PM ET. The scorecard is range-accuracy energy, not a direction call.
- Premium: Let VIX price it. Regimes: ZombieLand below 17, Goldilocks 1 from 17 to 24.5, Goldilocks 2 from 24.5 to 32, Chaos above 32. Know today’s expected move before the window; do not assume a crush.
- Structure: Defined risk only. Size so a tag of either wing is survivable — for example a debit butterfly inside the 5–10% width rule on our 0DTE butterfly strategy guide, with max loss known before entry.
- Plan, don’t predict: Write two close-to-close scenarios before 2:00 ET: finish inside 1× EM, or finish beyond it. We are not picking which one. This week’s forward daily expiries stay on FOMC implied move.
What comes after the October Fed decision?
This meeting ends Wed Oct 28. The next scheduled FOMC after that is Dec 8–9, with a SEP. Every remaining 2026 date is on our FOMC meeting schedule 2026.
Related reading: SPX expected move · This week’s FOMC implied moves · All FOMC Alerts coverage
Sources
- Federal Reserve issues FOMC statement (Board of Governors of the Federal Reserve System, 2026-09-16)
- FOMC Calendars (Federal Reserve, checked 2026-10-27)
- VIX term structure explained (Fed-day open-to-close base rates) (FatTail (WP 12910), published; cited 2026-10-27)
- 30-Day Fed Funds futures snapshot, Tue Oct 27 9:19 PM ET; odds are our calculation (CME Group (CBOT) via Massive market data, 2026-10-27)
Trade it with structure
Observer is a six-week trial and training program: train with Coach for $17/week. You get everything a full coaching member gets, every week, and the six weeks are designed to install pro trading habits: courses on strategy, process and risk management, live daily coaching, a Discord trade room with hundreds of experienced traders, and the platform (heatmap, GEX tools, risk graph, position analyzer and journal). Start Observer.
Educational content, not investment advice. Options involve risk and are not suitable for all investors. Past patterns are not forecasts. Nothing here is a trade recommendation.