


FOMC Alerts · October 26, 2026
Inflation expectations 2026: consumers and markets split
Inflation expectations in 2026 are telling two stories at once, two days before the Fed decides. Consumers in the University of Michigan survey now expect 3.5% inflation over the next five to ten years. Over a similar horizon, the bond market prices about 2.2%. The Fed says expectations are anchored. Which of those numbers it trusts is the question waiting for Chair Warsh on Wednesday.
Friday’s final October survey had sentiment at 48.0, the second-lowest reading on record after May’s 44.8. Current conditions came in at 46.7 and expectations at 48.8. Year-ahead inflation expectations rose to 4.7% and the 5-10 year measure to 3.5%. Both rose for the second straight month (University of Michigan). The headline numbers are old news. The split is what matters.
Why the Fed cares about inflation expectations
Expectations feed into the prices people actually set. If workers expect 4% inflation, they ask for raises to cover it. If businesses expect it, they price it in. Once that loop gets going, inflation is harder to bring down. That’s the risk the Fed has been describing for months.
Vice Chair Jefferson said on Oct. 1 that short-term survey measures are elevated, while most longer-term measures remain stable at levels consistent with 2%. He also spelled out the risk: “This potential uncertainty could lead to a rise in longer-term inflation expectations and affect wage- and price-setting decisions, and I am committed to avoiding this outcome.” (Federal Reserve)
The September minutes show the same concern on the Committee. Some participants said a higher policy rate would reduce the risk that elevated inflation unanchors expectations. Several noted that short-term measures were elevated (FOMC minutes).
“Anchored” means long-run expectations stay near the 2% target even when current inflation runs hot. “Unanchored” means they drift up with it. The Fed watches the long-run numbers most closely for that reason.
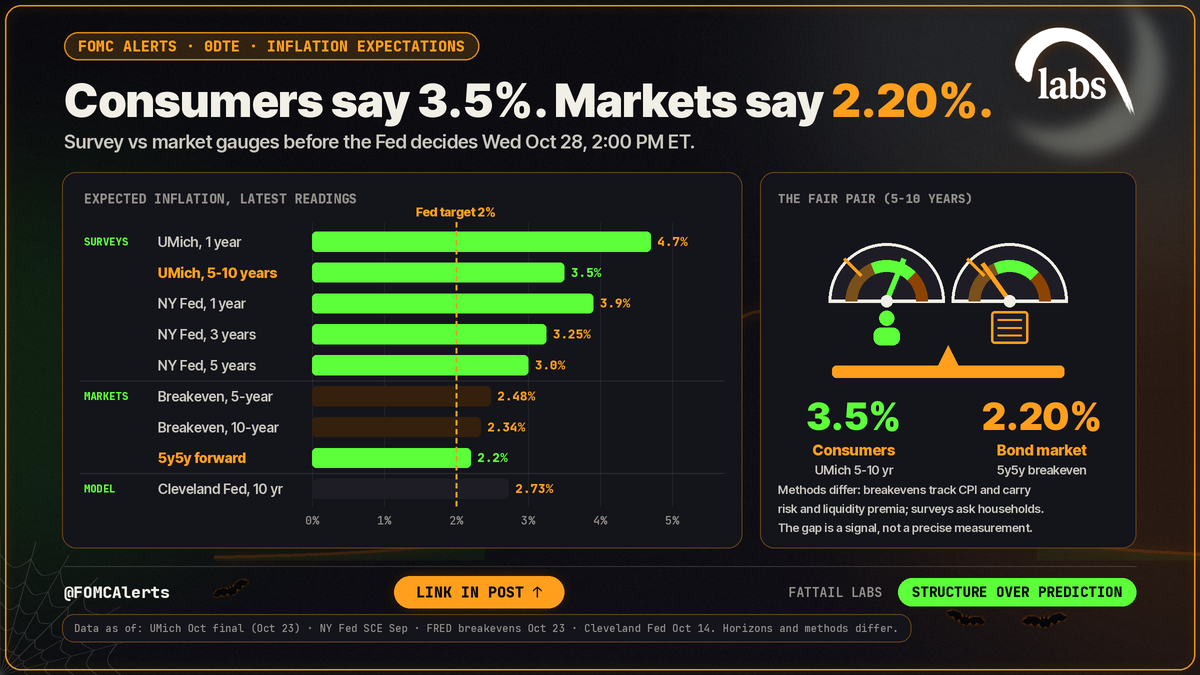
Four gauges, four different answers
No single number captures expectations. Here’s where each major gauge sits:
- UMich consumers: 4.7% over one year and 3.5% over five to ten years (October final).
- NY Fed Survey of Consumer Expectations: 3.9% over one year, 3.25% over three years and 3.0% over five years (September) (New York Fed).
- Market breakevens: the 5-year at 2.48%, the 10-year at 2.34% and the 5-year, 5-year forward at 2.20% (Oct. 23) (FRED: 5-year, 10-year, 5y5y).
- Cleveland Fed model: 2.73% over ten years, last updated Oct. 14 (Cleveland Fed).
The fair comparison is the UMich 5-10 year reading against the 5-year, 5-year forward breakeven: 3.5% against 2.20%. Comparing the 4.7% one-year survey with a five-year market rate mixes horizons. Even the fair pairing has limits. Breakevens are tied to CPI and carry risk and liquidity premia. Surveys ask households what they expect, and households weight the prices they see most, like gas and groceries. The methods differ, so the gap is a signal, not a precise measurement.
Gas makes the point. AAA’s national average was $4.286 a gallon on Oct. 26, against $3.053 a year earlier (AAA). The 30-year mortgage rate was 7.32% on Oct. 22, up from 6.19% a year before (Freddie Mac). UMich said buying conditions for durables fell 18% this month, citing higher interest rates and affordability. For the paycheck side, see whether wages are keeping up with inflation.
Advertisement · From FatTail Labs

Observer: train with Coach for $17/week
A six-week trial and training program built to install pro trading habits: live daily coaching, courses, a Discord trade room and the full FatTail platform.
How rare 3.5% is
By our count from UMich’s monthly data, the 5-10 year reading has been at or above 3.5% in 12 of 382 months since January 1995. Eleven of those came after February 2025. The 2024 range was 2.8% to 3.2%, and the 2019 range was 2.2% to 2.6% (UMich data).
UMich published a special report on Friday about the risk that expectations become entrenched after five years of above-target inflation. In UMich’s analysis, the 1960s-80s offer a warning: after each shock (Suez in 1967, the 1973 oil embargo and the 1978-79 Iranian Revolution), the low point in expectations settled higher than the one before (UMich special report). That’s history, not a forecast.
The Fed’s own warning about market measures
Breakevens look calm, and Fed officials have leaned on that. NY Fed President Williams said on Sep. 29 that survey- and market-based measures show expectations remain well anchored (New York Fed). Warsh said at Jackson Hole in August that medium-term measures look stable, then added a caveat: “The thing about market measures of inflation expectations in economic history is that they tend to look strong and durable until they don’t.” (Federal Reserve)
In the same passage, he called them well anchored and said keeping them that way is the Fed’s job. Fed officials are in their blackout period, which starts the second Saturday before a meeting and ends the day after it, so Oct. 17-29 this time. Nobody on the Committee has responded to Friday’s survey yet (FOMC communications policy). The first answer comes at the 2:30 PM ET press conference on Wednesday.
What’s priced, and what didn’t move
The target range is 3.75%-4.00% after the September hike (Federal Reserve). Our calculation from fed funds futures using CME’s method put an Oct. 28 hike at 10.0% and a range above today’s after December at 81.0% (Yahoo Finance delayed quotes). The quotes were identical before the 10:00 AM ET release (about 9:38-9:51 AM ET) and after it (about 2:12-2:25 PM ET Oct. 23). On Monday morning (quotes about 9:53-10:04 AM ET Oct. 26), the same calculation still had an Oct. 28 hike at 10.0%, with a range above today’s after December at 83.5%. Here’s how fed funds futures odds are calculated.
The prediction markets held steady too. Kalshi’s December hike contract sat at 71-72 cents both times (Kalshi). Polymarket went from 72-73 cents to 72-74 (Polymarket). By about 10:15 AM ET Monday, Kalshi was at 74-75 cents and Polymarket at 75-76. The survey confirmed the path the market already priced. It didn’t change it.
Abroad, the ECB’s consumer survey moved the same way. Euro-area 12-month expectations rose to 3.1% while the 5-year held at 2.5% (ECB). The Bank of Canada, at 2.25%, decides at 9:45 AM ET Wednesday with a Monetary Policy Report (Bank of Canada). Markets price an 80% chance of a hike, per Newsquawk.
What it means for 0DTE
- Energy: A hold is about 90% priced, so the move sits in the 2:30 PM ET press conference, not the 2:00 PM statement. Since 2019, on the 21 scheduled holds without projections, the median S&P 500 close-to-close move was 0.65% and the median intraday range was 1.14%. The index moved 1% or more on 42.9% of them. That describes the past and forecasts nothing.
- Wording: “Still anchored” and “we’re watching the surveys closely” point to different December odds. Same-day options carry that difference into the close.
- Sequencing: The Bank of Canada goes at 9:45 AM ET Wednesday. Q3 GDP and September PCE land Thursday at 8:30 AM ET, with the consensus forecast at 3.6% headline and 3.1% core year over year, per Newsquawk (BEA). Wednesday’s 0DTE prices the Fed. Thursday’s prices the data.
- Structure: Use defined risk, with the maximum loss known at entry. Map a hold that keeps December open, a hold that sounds softer, and a surprise hike. Know your structure for each before 2:00 PM ET.
Capital preservation comes first. The survey sets up the question. Warsh’s answer moves the tape.
Related reading
All of our Fed meeting coverage is in the FOMC Alerts hub.
For how energy prices feed into the rate outlook, see how oil prices affect interest rates.
Every post in the series is in the FOMC Alerts category.
Sources
- Surveys of Consumers: Final Results for October 2026 (University of Michigan, 2026-10-23)
- Risks of Entrenchment: Long-Run Inflation Expectations in Recent and Longer Historical Context (special report) (University of Michigan, 2026-10-23)
- Expected change in prices, 1-yr and 5-10 yr (monthly data, tbmpx1px5) (University of Michigan, 2026-10-23)
- Index of Consumer Sentiment (monthly data, tbmics) (University of Michigan, 2026-10-23)
- Survey of Consumer Expectations (September 2026) (Federal Reserve Bank of New York, 2026-10)
- Inflation Expectations (updated Oct 14, 2026) (Federal Reserve Bank of Cleveland, 2026-10-14)
- 5-Year, 5-Year Forward Inflation Expectation Rate (T5YIFR) (FRED, St. Louis Fed, 2026-10-23)
- 5-Year Breakeven Inflation Rate (T5YIE) (FRED, St. Louis Fed, 2026-10-23)
- 10-Year Breakeven Inflation Rate (T10YIE) (FRED, St. Louis Fed, 2026-10-23)
- Speech by Vice Chair Jefferson: The U.S. Economy and Monetary Policy (Federal Reserve, 2026-10-01)
- Minutes of the FOMC, September 15-16, 2026 (Federal Reserve, 2026-10-07)
- Keynote remarks by Chairman Warsh, Jackson Hole Economic Policy Symposium (Federal Reserve, 2026-08-28)
- Unwavering Dedication (Williams, University at Buffalo) (Federal Reserve Bank of New York, 2026-09-29)
- FOMC Policy on External Communications of Committee Participants (blackout period) (Federal Reserve, 2026-01-27)
- Federal Reserve issues FOMC statement (Sep 16, 2026) (Federal Reserve, 2026-09-16)
- 30-Day Fed Funds futures, Nov 2026 (ZQX26), delayed quotes (Yahoo Finance, 2026-10-26)
- Fed decision markets (KXFEDDECISION), public API (Kalshi, 2026-10-26)
- Fed decision in December? (Polymarket, 2026-10-26)
- National average gas prices (AAA, 2026-10-26)
- Primary Mortgage Market Survey (Freddie Mac, 2026-10-22)
- Consumer Expectations Survey results, September 2026 (European Central Bank, 2026-10-23)
- Upcoming events (Bank of Canada, 2026-10-23)
- Week in Focus, 26-30th October 2026 (Newsquawk, 2026-10-23)
- Release schedule (U.S. Bureau of Economic Analysis, 2026-10-23)
Trade it with structure
Observer is a six-week trial and training program: train with Coach for $17/week. You get everything a full coaching member gets, every week, and the six weeks are designed to install pro trading habits: courses on strategy, process and risk management, live daily coaching, a Discord trade room with hundreds of experienced traders, and the platform (heatmap, GEX tools, risk graph, position analyzer and journal). Start Observer.
Educational content, not investment advice. Options involve risk and are not suitable for all investors.