


FOMC Alerts · October 28, 2026
The 2 year Treasury yield closed at 4.70% on Tuesday, Oct 27, about 82 basis points above the effective fed funds rate of 3.88%. The Fed decides at 2:00 PM ET today, and futures put a hold at about 91% (our calculation, as of about 9:19 PM ET Tuesday). So for a 0DTE trader the useful question isn’t today’s decision. It’s how much tightening the 2-year has already priced beyond today, and how it tends to move when the statement hits.
What is the 2 year Treasury yield today?
The 2-year closed at 4.70% on Tuesday, Oct 27, on Treasury’s par curve (U.S. Treasury), up 2bp from Monday’s 4.68%. That’s 9 basis points lower than a week earlier (4.79% on Oct 20) and 11bp below Sep 25 (4.81%), but still 123bp above where 2025 ended (3.47% on Dec 31). This year’s range runs from 3.38% (Feb 27) to 4.92% (Sep 28).
The rest of the curve at Tuesday’s close: the 3-month bill at 4.22%, the 1-year at 4.50% and the 10-year at 4.99%. Last week’s drop is covered in why Treasury yields are falling, and the long end in why the 10-year is near 5%, so we won’t repeat them here.
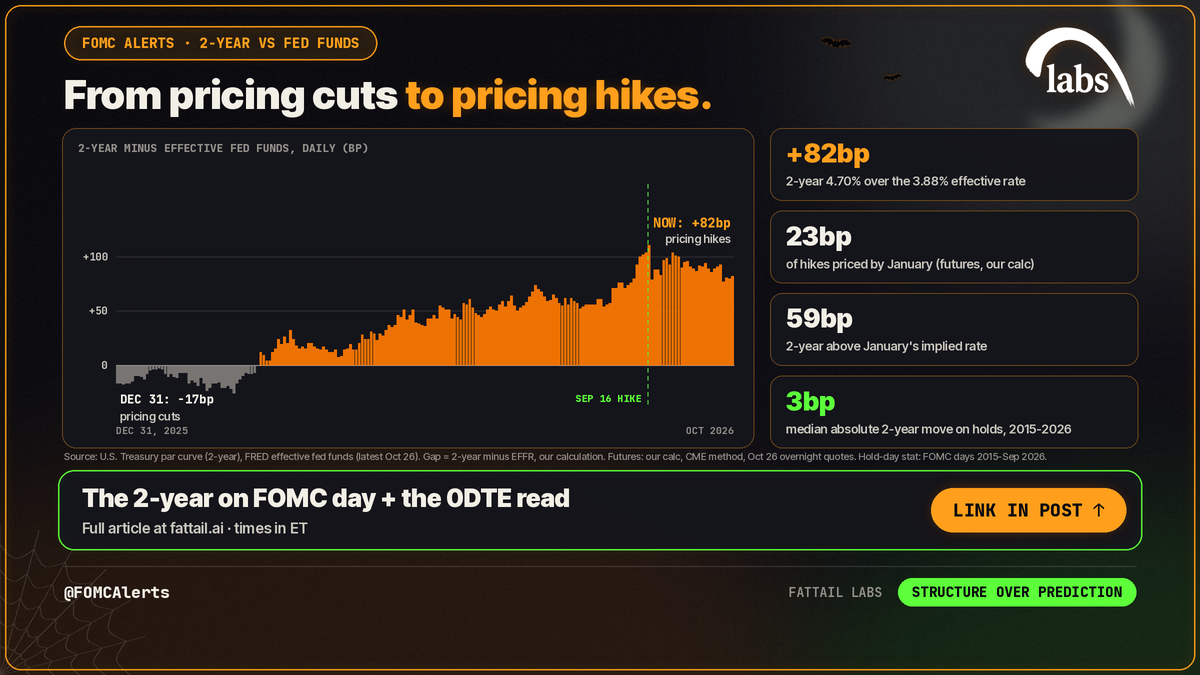
2 year Treasury yield vs fed funds rate: what does an 82bp gap mean?
The Fed’s target range has been 3.75% to 4.00% since the Sep 16 hike, and the effective rate was 3.88% on Oct 26 (New York Fed). With the 2-year at 4.70%, the gap is about +82bp (our calculation). On the same effective-rate basis, the gap was about -17bp at the end of 2025: the 2-year closed at 3.47% on Dec 31, below an effective rate of 3.64% inside a 3.50%-3.75% range, which is how the market prices cuts. In ten months it went from pricing cuts to pricing hikes.
Fed funds futures don’t explain all of it. Our calculation from fed funds futures using CME’s method (overnight quotes, Oct 26, 6:33-7:13 AM ET, not settlements) puts about 23bp of hikes in by January: an implied 4.10% at the end of December and 4.11% for the January average. That leaves the 2-year about 59bp above January’s implied rate. It also sits 57.5bp above the 4.125% median dot for 2027 in September’s projections (Federal Reserve). So the 2-year is pricing more tightening than the Fed’s own median, more compensation for holding it, or both.
What does the 2 year Treasury yield indicate about the Fed path?
One way to split it is the New York Fed’s ACM model, which divides a yield into an expected path for short rates and a term premium. It’s a model estimate, not a market price. On Oct 26 it fitted the 2-year at 4.68%: a 4.42% expected path plus a 0.26% term premium (New York Fed). Since Dec 31 the expected-path piece is up 102.4bp and the term premium only 18.6bp. By that read, most of this year’s rise is about where the market thinks the funds rate is going, and the expected path sits about 54bp above the latest effective rate.
That fits a hike-and-hold path that runs past January, not a string of back-to-back moves. Governor Christopher Waller made the timing point in an Oct 8 speech: “The hikes do not need to come at consecutive meetings, but they should be in place in an acceptable period of time.” (Federal Reserve). In September’s dots, 16 of 18 officials saw at least one more hike this year, and futures put at least one hike by Dec 9 at 79.1% (our calculation from fed funds futures using CME’s method, as of about 9:19 PM ET on Tue Oct 27). For how those odds are built, see how to read Fed rate odds.
Advertisement · From FatTail Labs

Observer: train with Coach for $17/week
A six-week trial and training program built to install pro trading habits: live daily coaching, courses, a Discord trade room and the full FatTail platform.
How does the 2 year Treasury yield move on FOMC day?
Our data covers 93 scheduled FOMC decisions from 2015 through September 2026, using daily closes. On holds (n=63), the median 2-year change was 0bp and the median absolute move 3bp. Holds that came right after a hike, which is today’s setup, number 11: median +1bp, median absolute 3bp, range -4bp to +7bp. Hike days moved more (n=21, median absolute 6bp).
2026 has run hotter. The 2-year rose on 5 of 6 FOMC days this year: +3bp on Jan 28, +8bp on Mar 18, +8bp on Apr 29, +15bp on Jun 17, -4bp on Jul 29 and +7bp on Sep 16. Six days is a small sample, but the lean has been toward higher yields on decision day.
For SPX, the size of the 2-year move has mattered more than the decision. On days the 2-year moved 5bp or more either way (n=41), the median absolute SPX move was 0.84%, the median range 1.24%, and 43.9% of days closed 1% or more. When it moved less than 5bp (n=52), those figures were 0.35%, 0.94% and 25.0%. Direction mattered too:
- 2-year down 5bp or more (n=23): median SPX +0.84%, and the VIX fell on 78.3% of days.
- 2-year up 5bp or more (n=18): median SPX -0.28%, and the VIX fell on only 33.3%.
These are close-to-close numbers, so they can’t separate the morning from the 2:00 PM reaction, and the subgroups are small. Read them as structure, not a forecast.
What does the 2 year Treasury yield mean for 0DTE today?
- Energy: FOMC is an energy input, and the 2-year is the fastest gauge of it. Watch it at 2:00 PM and again during Warsh’s 2:30 PM press conference: it shows whether the market thinks the hike path firmed or softened.
- Premium: Let the VIX price premium and check the SPX expected move before entry. Fed-day ranges can stretch past it, especially on days the 2-year moves 5bp or more.
- Structure: Defined risk, max loss known before entry. For a classic OTM butterfly, FatTail sizes width by VIX regime: ZombieLand (under 17) 20-30 points on SPX/ES, Goldilocks 1 (17-24.5) 30-40, Goldilocks 2 (24.5-32) 40-50, Chaos (above 32) 50+, at a debit of 5-10% of the width.
- Plan, don’t predict: Write down both cases before 2:00: the 2-year jumps (hike path firmer; historically the VIX fell less often) or it drops (path softer; the VIX fell more often). We aren’t calling either. Capital preservation first: size so being wrong is survivable.
What’s next for the 2-year after today’s Fed decision?
This meeting ends today. The next FOMC meeting is Dec 8-9, with new projections and dots at 2:00 PM ET on Wed Dec 9, and it’s the meeting the December odds above are pricing. Before then, Q3 GDP and September PCE land Thursday, Oct 29 at 8:30 AM ET, both inputs for the 2-year. All the dates are in our FOMC meeting schedule 2026, and every update is in the FOMC Alerts hub.
Related reading: Fed meeting this week · Fed funds futures probability · Why are Treasury yields falling? · All FOMC Alerts coverage
Sources
- Daily Treasury Par Yield Curve Rates (2026) (U.S. Treasury, 2026-10-27)
- Effective Federal Funds Rate (EFFR) (Federal Reserve Bank of New York, 2026-10-26)
- Summary of Economic Projections, September 16, 2026 (Federal Reserve Board, 2026-09-16)
- Treasury Term Premia (ACM model) (Federal Reserve Bank of New York, 2026-10-26)
- The Signaling Value of the Summary of Economic Projections (Governor Waller) (Federal Reserve Board, 2026-10-08)
- Market Yield on U.S. Treasury Securities at 2-Year Constant Maturity (DGS2) (FRED, Federal Reserve Bank of St. Louis, 2026-10-26)
- Meeting calendars and information (Federal Reserve Board, 2026-10-26)
Trade it with structure
Observer is a six-week trial and training program: train with Coach for $17/week. You get everything a full coaching member gets, every week, and the six weeks are designed to install pro trading habits: courses on strategy, process and risk management, live daily coaching, a Discord trade room with hundreds of experienced traders, and the platform (heatmap, GEX tools, risk graph, position analyzer and journal). Start Observer.
Educational content, not investment advice. Options involve risk and are not suitable for all investors.
FATTAIL BRIEFINGS
Get FatTail briefings in your inbox
Pick the lists you want. FOMC Alerts is selected by default.