


FOMC Alerts · October 29, 2026
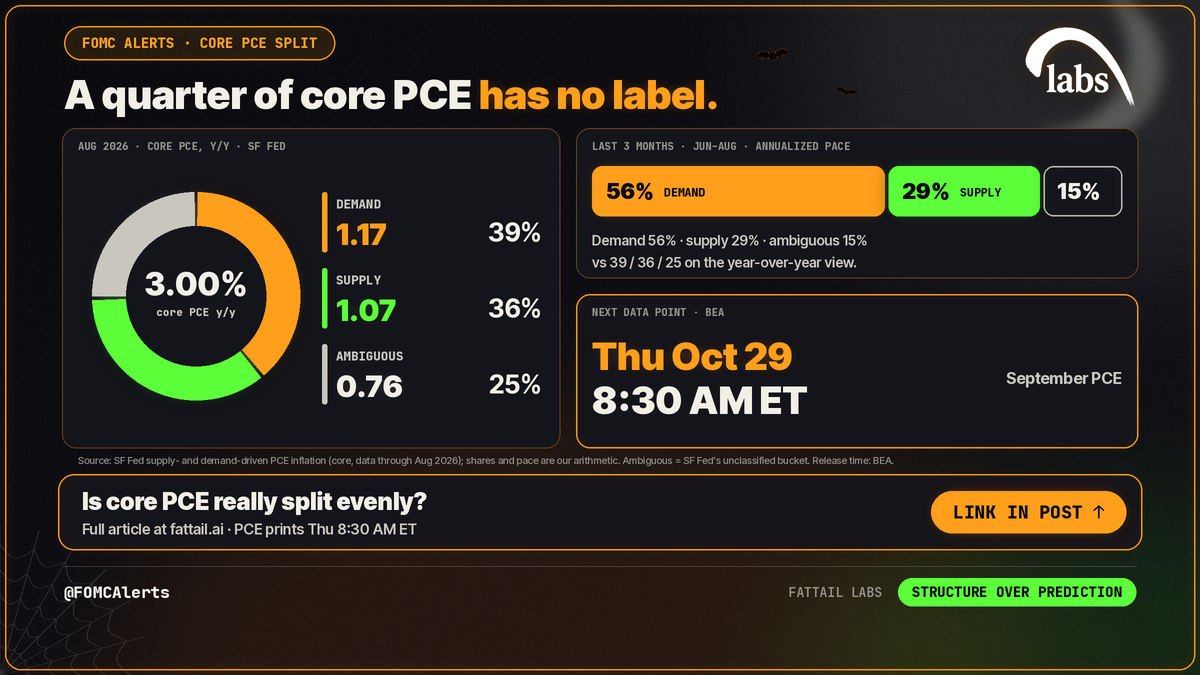
Supply vs demand driven inflation, in short: demand-driven inflation comes from spending that runs ahead of what the economy can supply, and rate hikes are built to cool it. Supply-driven inflation comes from constraints on what gets produced or shipped, which hikes can’t fix directly. The San Francisco Fed’s latest data (August) split core PCE inflation of 3.00% into 1.17 points demand-driven, 1.07 supply-driven and 0.76 unclassified: 39%, 36% and 25%. That is close to the “split evenly” line from Apollo’s Torsten Slok, but it leaves out the quarter nobody can classify. For what hikes can and can’t reach, see what Fed hikes can reach: energy, tariffs, housing.
The Fed decided on Wed Oct 28: held the federal funds target range at 3-3/4 to 4 percent on a 10–2 vote; Lisa D. Cook and Beth M. Hammack dissented, preferring to raise the target range by 1/4 percentage point. September PCE, the first hard inflation data since, prints Thu Oct 29 at 8:30 AM ET.
What is the difference between supply and demand driven inflation?
The SF Fed sorts each spending category in the PCE basket by the unexpected change in its price and in its quantity in a given month. If the two surprises move in the same direction, the category is labeled demand-driven. If they move in opposite directions, it is supply-driven. If either surprise is statistically indistinguishable from zero, it goes into “ambiguous.” The monthly contributions are then summed over 12 months to get the year-over-year figures, using Adam Shapiro’s method (SF Fed).
That is a statistical sort, not a verdict on any single price, and the SF Fed page doesn’t say which categories land where. Two more limits: the series covers core PCE, which excludes food and energy, and the page was updated Sep 30 with data through August. September’s reading arrives a few days after the BEA release on Thu Oct 29.
Is core PCE inflation split evenly between supply and demand?
Almost, with a catch. Slok wrote in Apollo’s Daily Spark that core PCE inflation at 3% “is split evenly between supply and demand,” citing the SF Fed’s chart (Apollo). Here are the August numbers as the SF Fed publishes them:
| Core PCE, Aug 2026, y/y | Points of 3.00% | Share |
|---|---|---|
| Demand-driven | 1.17 | 39% |
| Supply-driven | 1.07 | 36% |
| Ambiguous (unclassified) | 0.76 | 25% |
| Total | 3.00 | 100% |
Demand leads supply by 0.10 points, and among the categories the SF Fed can classify it is 52% demand and 48% supply. So “evenly” is a fair read of the two slices. It isn’t a fair read of the whole, because the 0.76 points of ambiguous inflation are a quarter of the total.
Has demand-driven inflation been rising since 2024?
Slok says the rise in the demand contribution since 2024 means inflation is no longer just a supply story. Whether the rise is big depends on the month you start from:
| Month | Demand | Supply | Ambiguous | Core PCE y/y |
|---|---|---|---|---|
| Aug 2024 | 0.80 | 1.35 | 0.75 | 2.90% |
| Dec 2024 | 1.12 | 0.90 | 0.88 | 2.90% |
| Dec 2025 | 0.81 | 1.46 | 0.59 | 2.86% |
| May 2026 | 1.18 | 1.05 | 0.93 | 3.16% |
| Aug 2026 | 1.17 | 1.07 | 0.76 | 3.00% |
Demand is up 0.37 points from Aug 2024 and 0.36 from Dec 2025, but only 0.05 above Dec 2024. Most of the 2026 shift is supply falling, from 1.46 to 1.07 since Dec 2025 (down 0.39), while demand rose 0.36 and ambiguous rose 0.17. Demand has sat above supply in each month from May through August 2026; before that, Dec 2024 was the only such month since Jan 2024.
The recent pace leans more toward demand than the year-over-year figures do. June through August monthly contributions, annualized, averaged 1.16 demand, 0.30 ambiguous and 0.60 supply: 56%, 15% and 29%. Monthly readings are noisy, though. Demand was 0.81 in July and 1.61 in August. For a different cut of the same 3%, see Goldman’s estimate of AI’s share of core PCE.
Can rate hikes fix supply-driven inflation?
That is the question behind Slok’s note, and he answers it in one line: “That matters for the Fed, because interest rates can cool demand-driven inflation but do little about supply shocks.” It’s an opinion, not something the SF Fed data can test, and other voices add nuance.
NY Fed President John Williams said on Sep 29 that policy can’t move ships or reopen pipelines and refineries, but it can reduce the risk that supply shocks spill over into broader, more persistent inflation (NY Fed). RBC Economics (Oct 23) wrote that hikes can’t solve supply-driven inflation, and aren’t well equipped to curb demand that comes from less rate-sensitive upper-income consumers and retirees (RBC).
With a quarter of the total unclassified and a 0.10-point gap between demand and supply, the mix doesn’t hand anyone a verdict on how far hikes should reach. It shows the argument is live.
The Fed’s Jul 29 statement said inflation was elevated “in part reflecting supply shocks that have driven price increases in certain sectors, including energy.” The Sep 16 statement said only “Inflation remains elevated.” The Oct 28 statement said only “Inflation remains elevated.” The word “supply” does not appear anywhere in the statement. It continued: “The accumulation of more information will help the Committee determine the policy stance appropriate to ensure a timely return of inflation to the Committee’s 2 percent goal.” At the press conference opening statement, Warsh said: “Energy and related prices have moved higher again in recent weeks. And our job is to ensure that relative price changes in some sectors do not broaden out across the economy, and that inflation expectations remain as they are anchored.” (Fed preliminary opening-statement transcript.)
Advertisement · From FatTail Labs

Observer: train with Coach for $17/week
A six-week trial and training program built to install pro trading habits: live daily coaching, courses, a Discord trade room and the full FatTail platform.
Is oil inflation supply driven or demand driven?
The SF Fed’s core series leaves out energy, so an oil shock can’t show up in it directly. Calling oil a supply shock here is Slok’s inference, not an SF Fed finding. The SF Fed’s headline series does include energy, and it doesn’t label oil cleanly either. In the August year-over-year headline split (3.43 points in total), supply is the smallest slice: 1.21 demand, 1.19 ambiguous and 1.03 supply. When energy prices jumped in March 2026, the headline’s annualized monthly contribution was 7.77 points, and 5.40 of them landed in ambiguous, with 1.65 in demand and 0.72 in supply.
The price move itself is not in doubt: U.S. gasoline was up 34.2% from a year earlier in September (BLS CPI, our calculation from the index). Why the Fed treats an oil shock differently from a demand shock is in our guide to how oil prices affect interest rates.
What should you watch in the September core PCE report?
BEA releases September Personal Income and Outlays on Thu Oct 29 at 8:30 AM ET, alongside advance Q3 GDP (Thursday’s GDP and PCE preview covers the mechanics). August core PCE rose 0.2% m/m and 3.0% y/y (BEA). Forecasts for September core:
- Cleveland Fed nowcast (a model, as of Oct 26): +0.28% m/m, 3.05% y/y.
- TD Securities (Oct 15 summary republished by Octa): +0.32% m/m, 3.1% y/y.
- RBC Economics (Oct 23): +0.4% m/m, 3.1% y/y.
- Named consensus: +0.3% m/m, 3.1% y/y, FactSet consensus (via Morningstar), as of Morningstar article ahead of the Oct 29 release (fetched Wed Oct 28 ~9:33 PM ET). Headline PCE FactSet: +0.5% m/m, 3.7% y/y.
The arithmetic is simple. September 2025’s core gain was about 0.23%, so, by our calculation from FRED’s core PCE price index and assuming no revisions, a gain of roughly 0.28% rounds the year-over-year rate up to 3.1%, about 0.38% rounds it to 3.2%, and 0.2% leaves it near 3.0%. That is arithmetic, not a forecast.
The headline number won’t say whether September looks demand-led. RBC flags airfares and hospital inpatient care as upside pressure in PCE, but the SF Fed labels categories after the release and updates its page a few days later, so on release morning the page still shows August.
Why the print matters for the Fed: after the decision, fed funds futures price an 84.5% chance of a hike by the Dec 8-9 meeting (our calculation from fed funds futures using CME’s method, as of Wed Oct 28 evening, Yahoo delayed CBOT chart quotes: ZQX26 96.115 as of 7:45:00 PM ET, ZQZ26 95.965 as of 9:24:14 PM ET). A print that confirms the demand-driven slice gives that pricing more to confirm; a soft print would pull it the other way. That is scenario mapping, not a call.
What does the supply vs demand inflation split mean for 0DTE traders?
- Energy: In 2026, the session after the decision has carried the movement. After each of the six meetings this year, the next session’s median absolute SPX move was 1.05%, with four of six at 1% or more, and the VIX closed lower on none of the six decision days (our calculation from Cboe and FRED daily closes; six meetings is a small sample). Thu Oct 29 at 8:30 AM ET, with core PCE and Q3 GDP, is the next session after the decision.
- Premium: The VIX closed at 16.91 on Wed Oct 28 (Cboe) and the 2-year Treasury yield was 4.67% (Wed Oct 28, Treasury) after the decision. That puts volatility in ZombieLand (under 17). In our framework, VIX under 17 is ZombieLand, 17 to 24.5 is Goldilocks 1, 24.5 to 32 is Goldilocks 2, and above 32 is Chaos. Check the expected move the options market is pricing before you size anything.
- Structure: If you sell premium, keep it defined-risk, such as an iron condor with max loss known before entry, and size so a tag of either wing is survivable.
- Plan, don’t predict: Write down both outcomes for the 8:30 AM ET print before it lands: core above the forecasts, or below. We aren’t predicting which. Next after that: the Dec 8-9 meeting. Don’t assume implied volatility will fall after the event.
What comes after the Fed’s October meeting?
The October meeting ended Wed Oct 28. The next FOMC meeting is Dec 8-9 (SEP meeting; verified on federalreserve.gov FOMC calendars). Every remaining date is in our FOMC meeting schedule 2026.
Related reading: What Fed hikes can reach · Q3 GDP and PCE preview · FOMC Alerts hub
Sources
- The Inflation Debate Is No Longer Just About Supply (The Daily Spark, Torsten Slok) (Apollo Global Management, 2026-10-27)
- Supply- and Demand-Driven PCE Inflation (data through Aug 2026; updated Sep 30) (Federal Reserve Bank of San Francisco, 2026-09-30)
- Personal Income and Outlays, August 2026 (U.S. Bureau of Economic Analysis, 2026-09-30)
- BEA release schedule (Sep Personal Income and Outlays and Q3 GDP advance, Thu Oct 29, 8:30 AM ET) (U.S. Bureau of Economic Analysis, 2026-10-27)
- PCE excluding food and energy, chain-type price index (PCEPILFE) (FRED, St. Louis Fed (source: BEA), 2026-10-23)
- Inflation Nowcasting (Federal Reserve Bank of Cleveland, 2026-10-26)
- Growth to remain strong despite inflation headwinds (RBC Economics, 2026-10-23)
- United States: PCE Inflation forecast and Fed stance – TD Securities (Octa (summarizing TD Securities), 2026-10-15)
- Consumer Price Index – September 2026 (U.S. Bureau of Labor Statistics, 2026-10-14)
- Unwavering Dedication (John C. Williams) (Federal Reserve Bank of New York, 2026-09-29)
- Federal Reserve issues FOMC statement, July 29, 2026 (Federal Reserve Board, 2026-07-29)
- Federal Reserve issues FOMC statement, September 16, 2026 (Federal Reserve Board, 2026-09-16)
- VIX daily price history (CSV) (Cboe, 2026-10-26)
- Daily Treasury Par Yield Curve Rates, 2026 (U.S. Treasury, 2026-10-26)
- 30-Day Fed Funds futures (ZQV26, ZQX26, ZQZ26), delayed quotes; odds are our calculation (CBOT via Yahoo Finance (delayed), 2026-10-26)
Trade it with structure
Observer is a six-week trial and training program: train with Coach for $17/week. You get everything a full coaching member gets, every week, and the six weeks are designed to install pro trading habits: courses on strategy, process and risk management, live daily coaching, a Discord trade room with hundreds of experienced traders, and the platform (heatmap, GEX tools, risk graph, position analyzer and journal). Start Observer.
Educational content, not investment advice. Options involve risk and are not suitable for all investors.
FATTAIL BRIEFINGS
Get FatTail briefings in your inbox
Pick the lists you want. FOMC Alerts is selected by default.