


FOMC Alerts · October 27, 2026
What is the Taylor rule?
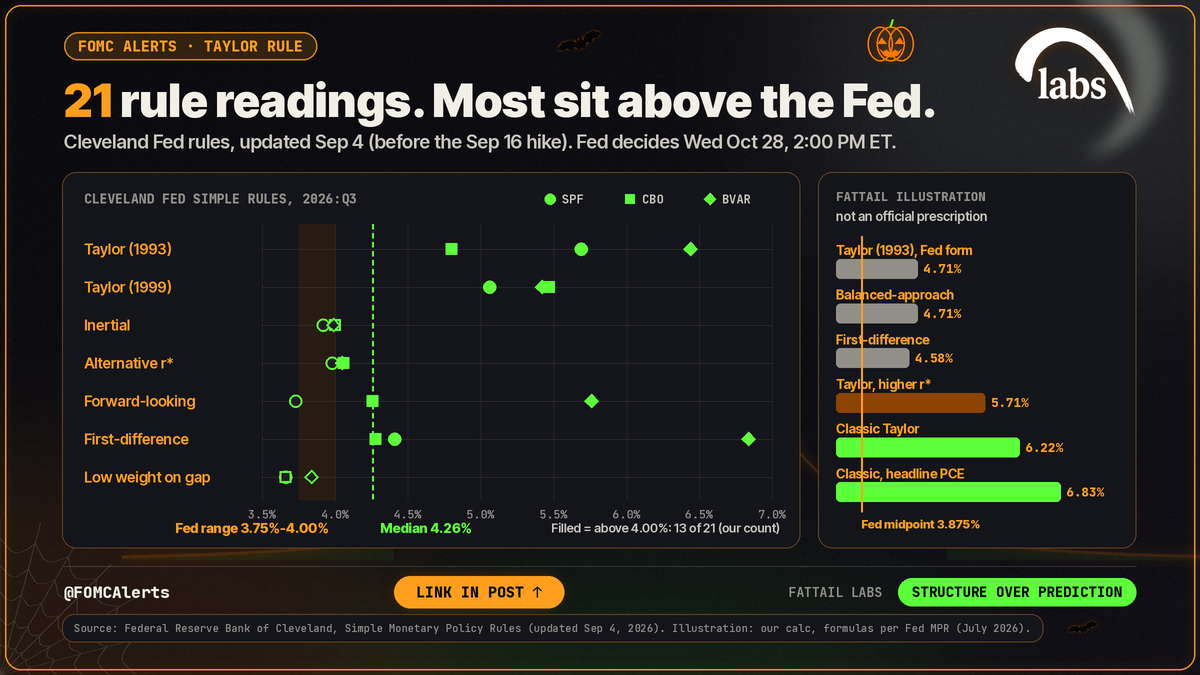
What is the Taylor rule? It’s a one-line formula that turns inflation and economic slack into a suggested federal funds rate. The FOMC meeting starts today. The statement lands Wednesday at 2:00 PM ET, and the Fed’s target range sits at 3.75%-4.00% after the September hike (Federal Reserve). The Cleveland Fed’s simple policy rules put the rate anywhere from 3.66% to 6.84%, with a median of 4.26% (Cleveland Fed). The rules agree on direction. They disagree on distance.
The 1993 version, named for economist John Taylor, adds four pieces: a neutral real rate (r*), current inflation, half the gap between inflation and the 2% target, and half the output gap. The Fed’s own write-ups swap the output gap for the gap between unemployment and its longer-run level. The balanced-approach rule doubles that slack weight, and inflation is measured as 4-quarter core PCE (Fed Monetary Policy Report, July 2026).
The key mechanic: every point of inflation above target adds 1.5 points to the prescribed rate. One input, r*, can’t be observed at all. That’s where most of the disagreement starts.
The inputs right now
- Inflation: core PCE ran 3.0% year over year in August, headline 3.4% (BEA). September PCE arrives Thursday, Oct 29, at 8:30 AM ET, the morning after the decision. September CPI was 3.7%, core 2.6% (BLS).
- Slack: unemployment was 4.2% in September (FRED). The Fed’s longer-run projection is 4.2%. The CBO’s estimate is 4.39% (FRED/CBO). By our calculation from real GDP against CBO potential output, the output gap was +1.40% in Q2 (FRED/CBO).
- Neutral: the September projections put the longer-run fed funds rate at 3.2% (Fed SEP). Less 2% inflation, that implies a neutral real rate near 1.2% (our arithmetic). The textbook rule uses 2%.
What the Cleveland Fed’s 21 readings show
The Cleveland Fed runs seven rules against three forecast sets: professional forecasters (SPF), the CBO, and its own BVAR model. The current page covers 2026:Q3. It was updated Sep 4, with forecasts as of Sep 3, which is before the Sept. 16 hike. The next update is due Nov 20.
| Rule (2026:Q3) | SPF | CBO | BVAR |
|---|---|---|---|
| Taylor (1993) | 5.69% | 4.80% | 6.44% |
| Taylor (1999) | 5.06% | 5.47% | 5.42% |
| Inertial | 3.92% | 4.00% | 3.99% |
| Alternative r* | 3.98% | 4.06% | 4.05% |
| Forward-looking | 3.73% | 4.26% | 5.76% |
| First-difference | 4.41% | 4.28% | 6.84% |
| Low weight on gap | 3.66% | 3.66% | 3.84% |
By our count, 13 of the 21 readings sit above 4.00%, the top of today’s range, and 17 of 21 sit above the 3.875% midpoint. The inertial rules land almost on the current range because they lean on where the rate already is. The highest readings come from the classic and first-difference rules on the BVAR forecasts.
The Fed’s July report found the same tilt earlier in the year: rules called for first-quarter rates a little above the then 3.50%-3.75% range. The Atlanta Fed’s Taylor Rule Utility lets you change the inputs yourself. It updates next on Oct 29.
A third read tells a similar story. Per AIER, its rules dashboard runs from about 3.8% to 5.7%, and nine of its 12 rules favor tighter policy (The Daily Economy). We haven’t verified the dashboard itself, so treat those as AIER’s figures.
Why the rules disagree: our illustration
To show how much the inputs matter, we ran the formulas from the Fed’s report box on the latest data. This is a FatTail illustration, not an official prescription. It’s single-period and unsmoothed.
| Variant (FatTail illustration) | Key choices | Result |
|---|---|---|
| Taylor (1993), Fed form | r* 1.2, unemployment gap vs 4.2%, core PCE | 4.71% |
| Balanced-approach | Same inputs; slack gap is zero | 4.71% |
| First-difference | Starts from the 3.875% midpoint | 4.58% |
| Taylor, higher r* | r* 2, CBO unemployment rate | 5.71% |
| Classic Taylor | r* 2, CBO output gap +1.40% | 6.22% |
| Classic, headline PCE | Same, with 3.42% headline inflation | 6.83% |
Every variant lands above the 3.875% midpoint, but the answers run from 4.58% to 6.83%. Most of that spread comes from two choices: the r* assumption and the slack measure. Moving r* from 1.2 to 2 adds 0.8 points on its own. That’s why “the Taylor rule says X%” is the wrong sentence. The rules give you a range and a direction, not a number.
Advertisement · From FatTail Labs

Observer: train with Coach for $17/week
A six-week trial and training program built to install pro trading habits: live daily coaching, courses, a Discord trade room and the full FatTail platform.
Why the Fed doesn’t just follow a rule
The Fed’s own report is blunt about it: “Practical considerations make it undesirable, at present, for the FOMC to adhere strictly to the prescriptions of any single rule.” It adds that prescriptions should be read with care (Federal Reserve). The rules work as a cross-check on the Fed, not as its autopilot.
Officials’ own words tell you more about timing. New York Fed President John Williams, the FOMC Vice Chair and a voter, said on Sep 29: “If the economy evolves in a manner broadly consistent with my forecast, one further upward adjustment of the federal funds target range may be appropriate late this year to support a timelier return of inflation to target.” In the same speech he said the September move removed any urgency (New York Fed).
San Francisco Fed President Mary Daly, a 2026 alternate rather than a voter, told Reuters on Oct 14 that more increases are more likely than not, but the timing is still under discussion (Reuters via StreetInsider).
Where projections and markets sit
The September median projection for end-2026 is 4.1%, one more quarter-point hike from today’s midpoint (Fed SEP). These are projections, not promises, and October brings no new ones. The next set comes with the Dec 8-9 meeting (Fed calendar).
Our calculation from fed funds futures using CME’s method (Monday’s Oct 26 settlements, via delayed Yahoo quotes checked about 8:55 AM ET Oct 27) put a hike on Oct 28 at 11.1%. It put the odds of a range above today’s after December in the mid-to-high 80s. On Oct 23 quotes, the same calculation gave 10.0% and 81.0%. Here’s how fed funds futures odds are calculated.
The prediction markets lean the same way. As of about 8:55 AM ET Oct 27, Kalshi had an October hike at 6-7 cents and a December hike at 74-75 cents (Kalshi). Polymarket showed 5-6 cents for October and 75-76 cents for December (Polymarket). Those December contracts price that meeting alone. They aren’t cumulative.
What a hold after a hike has looked like
Since 2008, the Fed has held right after a hike 11 times, from January 2016 to September 2023. The next move was another hike in 9 of the 11. Cuts followed the January 2019 and September 2023 holds. On those decision days, the median S&P 500 close-to-close move was 0.13%, the median intraday range was 0.93%, and the VIX fell on 36% of them. Eleven meetings is a small sample, so this describes the past and forecasts nothing. Our Fed rate hike history has the full record.
The wider record since 2015 gives better context. Across 93 FOMC days, the median S&P 500 range was 1.11%, against 0.87% on other days. On the 47 meetings without projections, the median range was 0.99%.
What it means for 0DTE
- Energy: The rules point above the range. That puts the energy in the wording, not the decision. Watch the 2:00 PM ET statement, then Chair Warsh at 2:30 PM ET, and how either treats December. September PCE hits at 8:30 AM ET Thursday, so a position held overnight carries a second event.
- Premium: The VIX closed at 18.39 on Monday, Oct 26, down from 19.45 on Friday (Cboe). That’s the price of premium going into the week. Check it again Wednesday morning before sizing.
- Structure: Use defined risk with the maximum loss known at entry, such as an iron condor. The statement and the press conference are two separate moves, so size for both.
- Plan, don’t predict: Map three scenarios. First, a hold that keeps December open, the outcome markets price most. Second, a hold whose softer wording pushes December out. Third, a hike, at about 11% in our futures calculation. Have a structure for each before 2:00 PM ET.
Capital preservation comes first. The rules tell you the direction of the debate. They don’t tell you the next tick.
When is the next FOMC meeting?
This week’s meeting ends Wed Oct 28 with the statement at 2:00 PM ET. The next FOMC meeting is Dec 8-9, which brings the next set of projections. Every 2026 date, plus the blackout periods and the data in between, is in our FOMC meeting schedule 2026.
Related reading
All of our Fed meeting coverage is in the FOMC Alerts hub.
Every post in the series is in the FOMC Alerts category.
Sources
- Federal Reserve issues FOMC statement (Sep 16, 2026) (Federal Reserve, 2026-09-16)
- Meeting calendars and information (Federal Reserve, 2026-10-23)
- Summary of Economic Projections, Table 1 (Sep 16, 2026) (Federal Reserve, 2026-09-16)
- Monetary Policy Report, July 2026, Part 2 (policy rules box) (Federal Reserve, 2026-07-10)
- Simple Monetary Policy Rules (updated Sep 4, 2026) (Federal Reserve Bank of Cleveland, 2026-09-04)
- Taylor Rule Utility (Federal Reserve Bank of Atlanta, 2026-10-14)
- Personal Income and Outlays, August 2026 (BEA, 2026-09-30)
- Consumer Price Index, September 2026 (BLS, 2026-10-14)
- Unemployment Rate (UNRATE) (FRED / BLS, 2026-10-23)
- Noncyclical Rate of Unemployment (NROU) (FRED / CBO, 2026-10-23)
- Real Potential GDP (GDPPOT) and CBO estimates (FRED / CBO, 2026-10-23)
- Unwavering Dedication (John Williams speech, Sep 29, 2026) (Federal Reserve Bank of New York, 2026-09-29)
- Exclusive: Fed's Daly says rate hikes likely needed, but not urgently (Reuters via StreetInsider, 2026-10-14)
- The Fed Can Pause, But Inflation Won't (Matthew Schaffer) (AIER / The Daily Economy, 2026-10-23)
- 30-Day Fed Funds futures, Dec 2026 (ZQZ26), delayed quotes (Yahoo Finance / CBOT, 2026-10-27)
- Fed decision markets (KXFEDDECISION, public API; prediction market) (Kalshi, 2026-10-27)
- Fed decision in December? (prediction market) (Polymarket, 2026-10-27)
- VIX historical data (daily closes) (Cboe, 2026-10-26)
Trade it with structure
Observer is a six-week trial and training program: train with Coach for $17/week. You get everything a full coaching member gets, every week, and the six weeks are designed to install pro trading habits: courses on strategy, process and risk management, live daily coaching, a Discord trade room with hundreds of experienced traders, and the platform (heatmap, GEX tools, risk graph, position analyzer and journal). Start Observer.
Educational content, not investment advice. Options involve risk and are not suitable for all investors.