


What a Short Butterfly Spread Is
A short butterfly spread is the inverse of a long butterfly. You sell the body and buy the wings — paying a net debit to enter a position that profits when the stock moves away from the centre strike in either direction. Where the long butterfly wants the stock to sit still, the short butterfly spread wants movement.
The short butterfly spread is a defined-risk volatility trade. You profit when the stock finishes outside the wing strikes at expiration. Your maximum loss occurs if the stock pins exactly at the centre strike — the worst-case scenario is the body expiring at maximum value while the wings expire worthless. The maximum loss is the wing width minus the debit paid.
This guide covers the construction, payoff math, when the short butterfly spread makes sense, and how it compares to other volatility strategies like long straddles and long strangles.
How the Short Butterfly Spread Is Constructed
The short butterfly spread uses three strikes with all calls or all puts, sharing the same expiration:
Using calls:
- Buy 1 lower-strike call (lower wing)
- Sell 2 centre-strike calls (the body — generates credit that partially offsets the wings)
- Buy 1 upper-strike call (upper wing)
The strikes are equidistant. If the centre is $550, the wings might be $540 and $560 — a $10-wide short butterfly spread. You are buying the wings and selling the body, which is the opposite of a standard butterfly spread.
Example: SPY at $550. Short the $540/$550/$560 call butterfly with 30 DTE.
- Buy 1 $540 call for $14.50
- Sell 2 $550 calls for $8.80 each ($17.60 total credit)
- Buy 1 $560 call for $4.80
Net debit: ($14.50 + $4.80) – $17.60 = $1.70 ($170 per contract).
- Maximum profit: $1.70/share ($170 per contract) — occurs when SPY is below $540 or above $560 at expiration
- Maximum loss: $10.00 (wing width) – $1.70 (debit) = $8.30/share ($830 per contract) — occurs at exactly $550
- Lower breakeven: $540 + $1.70 = $541.70
- Upper breakeven: $560 – $1.70 = $558.30
The risk-reward is inverted compared to the long butterfly. The long butterfly risks a small debit for a large potential profit at one price. The short butterfly spread risks a large loss at one price for a small profit across a wide range. You are betting the stock moves — the direction does not matter, only the magnitude.

Short Butterfly Spread Payoff and Breakeven Math
The payoff diagram is an inverted tent — the opposite of the long butterfly’s tent shape:
- Below the lower wing ($540): Maximum profit. All options are deep ITM and offset each other. You keep the credit minus the debit structure cost. Profit = wing width minus the total debit paid… wait. Let me clarify the actual mechanics.
Let me walk through the expiration scenarios precisely:
- SPY below $540: All calls expire worthless. Your net loss is the debit paid: $1.70. Wait — that is wrong for this structure. Let me recalculate.
Actually, let me reconstruct this properly. The short butterfly is typically entered for a credit, not a debit. When you sell a butterfly, you are selling the structure — which means you receive the butterfly’s value as a credit.
Corrected construction: Selling a call butterfly means:
- Sell 1 lower-strike call at $540 for $14.50
- Buy 2 centre-strike calls at $550 for $8.80 each ($17.60 total)
- Sell 1 upper-strike call at $560 for $4.80
Net credit: ($14.50 + $4.80) – $17.60 = $1.70 ($170 per contract).
- Maximum profit: $1.70/share ($170 per contract) — occurs when SPY is below $540 or above $560 at expiration. All legs offset or expire worthless, and you keep the credit.
- Maximum loss: $10.00 (wing width) – $1.70 (credit) = $8.30/share ($830 per contract) — occurs at exactly $550, where the short calls at the wings are at maximum pain relative to the long calls at the centre.
- Lower breakeven: $540 + $1.70 = $541.70
- Upper breakeven: $560 – $1.70 = $558.30
The payoff zones:
- Below $540: All calls expire worthless. You keep the full $1.70 credit. Maximum profit.
- $540 to $541.70: The short $540 call is slightly ITM, eating into profit. Still profitable above the lower breakeven.
- $541.70 to $550: Loss zone. The short $540 call gains value faster than the long $550 calls. Loss increases toward the centre.
- At $550: Maximum loss. The short $540 call is worth $10, the long $550 calls are ATM (minimal value), and the short $560 call is worthless. Net loss = $8.30.
- $550 to $558.30: Loss zone. The long $550 calls start gaining, reducing the loss as the stock moves away from the centre.
- $558.30 to $560: Profitable again above the upper breakeven.
- Above $560: All ITM calls offset. You keep the full $1.70 credit. Maximum profit.
Breakeven formulas:
- Lower breakeven = lower strike + credit received
- Upper breakeven = upper strike – credit received
When to Use a Short Butterfly Spread
The short butterfly spread is a niche structure. It is not the most efficient way to bet on movement, but there are specific situations where it fits:
You expect a large move but want defined risk. A long straddle profits from movement but costs significant premium. The short butterfly spread collects a credit and profits from movement — but the profit is capped at the credit received. The trade-off is clear: the straddle has unlimited profit potential with a larger capital outlay. The short butterfly has capped profit with a smaller or zero net cost. Use the short butterfly when the straddle is too expensive relative to the expected move.
Pre-earnings volatility expansion. Before earnings, implied volatility expands and butterfly spreads increase in value. Selling a butterfly before the event captures the IV expansion — if the stock gaps far enough in either direction after earnings, the butterfly collapses to zero and you keep the credit. If the stock pins near the centre strike, you face maximum loss. This is a binary bet on the stock making a large post-earnings move.
Low-IV environments where you expect a regime change. When IV is at historically low levels (below 20th percentile) and you expect a catalyst to increase realised volatility, the short butterfly spread is cheaper than a straddle because you are selling options at the centre that partially fund the position. The credit structure means you do not pay much upfront — you profit if the anticipated vol expansion materialises as a stock move.
Hedging a long butterfly. If you hold a long butterfly that is currently profitable and you want to lock in gains without closing, selling a narrower butterfly at the same centre strike partially hedges the position. This is an advanced technique primarily used by market makers and institutional traders.

Short Butterfly Spread vs Other Volatility Strategies
The short butterfly spread competes with several other structures for volatility exposure:
vs Long straddle: The straddle buys an ATM call and ATM put — unlimited profit potential in both directions, but costs $15-$20 on a $550 stock. The short butterfly spread collects $1.70 in credit but caps profit at that amount. Use the straddle when you expect a very large move (5%+). Use the short butterfly when you expect a moderate move (2-3%) that takes the stock outside the wings.
vs Long strangle: The strangle buys OTM calls and puts — cheaper than the straddle but needs a larger move to profit. The short butterfly has a similar “profit from movement” thesis but with a credit structure. The strangle has higher profit potential; the short butterfly has lower capital at risk.
vs Short iron condor: An iron condor profits when the stock stays in a range — the opposite of the short butterfly’s thesis. However, a short iron condor (buying the condor) profits from movement, similar to the short butterfly. The key difference is the payoff shape: the short butterfly has maximum loss at one price (the centre), while the long iron condor has maximum loss across a range (between the short strikes).
vs Short iron butterfly (buying the iron butterfly): Buying an iron butterfly is structurally equivalent to selling a butterfly — both profit from the stock moving away from the centre. The iron butterfly version uses both calls and puts (four legs) while the short butterfly uses only calls or only puts (three legs). On liquid underlyings, check which has tighter spreads across all legs.
Managing the Short Butterfly Spread
The CBOE options specifications govern settlement mechanics for index options — relevant if you trade short butterflies on SPX, which settles in cash. The OCC options calculator can model the payoff at different stock prices to visualise the inverted tent before entering.
Profit target: close at 50-75% of maximum credit. On a $1.70 credit, close the position when the butterfly can be bought back for $0.40-$0.85 (capturing $0.85-$1.30 of profit). Holding for the full credit requires the stock to finish well outside both wings at expiration, which is a high bar.
Close if the stock settles near the centre. If the stock moves to within $2-3 of the centre strike and shows no signs of moving further, close the position. Holding a short butterfly with the stock near the centre and time decaying is a losing proposition — the butterfly’s value increases as expiration approaches with the stock pinned at the centre.
Time-based exit: close by 10-14 DTE. Gamma accelerates in the final two weeks, and the short butterfly’s risk is concentrated at the centre strike where gamma is highest. If the stock is near the centre with 10 DTE remaining, the position can swing from profit to maximum loss in a single session. Close early to avoid this.
Do not add to a losing position. If the stock is near the centre strike and the butterfly is gaining value (moving against you), do not sell another butterfly to “average down.” The additional risk compounds — two short butterflies at the same centre doubles your maximum loss at a price where you are already wrong.
The Greeks of a Short Butterfly Spread
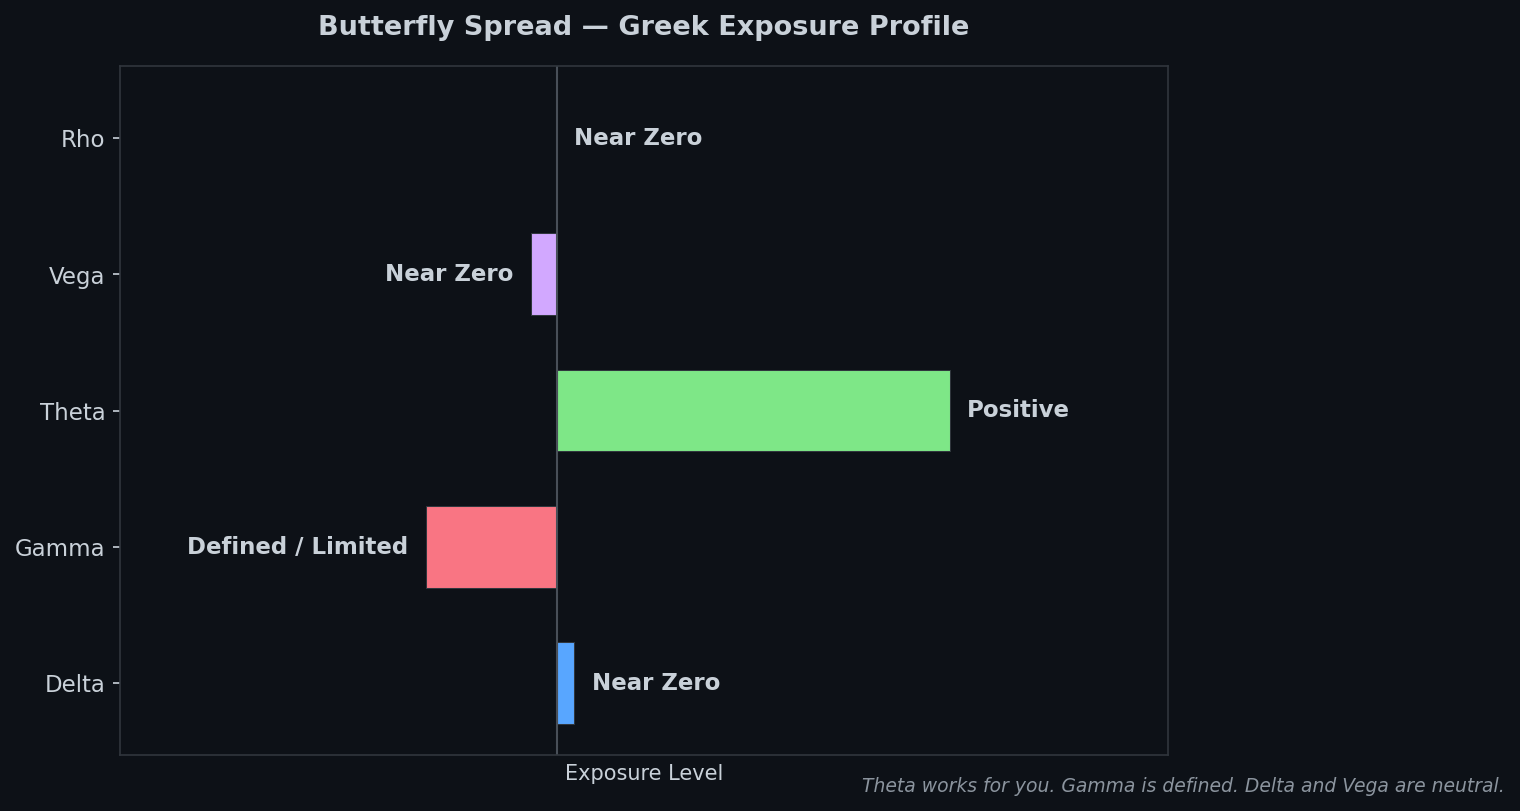
Understanding the greek exposure of the short butterfly spread helps with management:
- Delta: Near zero at entry (the structure is approximately delta-neutral). Delta becomes positive as the stock moves above the centre and negative as it moves below. This is the desired behaviour — you gain directional exposure in the direction the stock is already moving.
- Gamma: Negative near the centre strike (the 2 long calls at the centre dominate). Wait — actually for a short butterfly (sell wings, buy centre), gamma is positive near the centre. You are long gamma, meaning delta moves in your favour as the stock moves. This is the key advantage of the short butterfly: positive gamma near the centre creates a self-adjusting position.
- Theta: Negative near the centre. You are paying time decay because you are net long options at the centre. The time decay works against you, which is why you need the stock to move before expiration erodes the position’s value.
- Vega: Positive. Higher IV increases the value of the long centre options more than the short wings. If IV expands, the short butterfly becomes more profitable even without a stock move. If IV contracts, the position loses value.
Summary: The short butterfly spread is long gamma, long vega, short theta. It profits from movement and IV expansion, but bleeds time value daily. This is the opposite greek profile of a premium-selling strategy — you are paying for the optionality of movement rather than collecting for the expectation of stasis.
Example: Short Butterfly Before an FDA Decision
XYZ Biotech at $85, with an FDA drug approval decision in 10 days. The stock will either gap to $100+ (approval) or drop to $65-$70 (rejection). IV is elevated at the 90th percentile. A long straddle costs $12.00 — too expensive. The expected move is $15, so the straddle barely breaks even even on a large move.
Setup: Sell the $75/$85/$95 call butterfly with 14 DTE.
- Sell 1 $75 call for $12.50
- Buy 2 $85 calls for $7.00 each ($14.00 total)
- Sell 1 $95 call for $3.20
Net credit: ($12.50 + $3.20) – $14.00 = $1.70 ($170 per contract).
Scenario A — FDA approval, stock gaps to $105: All calls deep ITM. The $75 call is worth $30, the two $85 calls are worth $40 total, the $95 call is worth $10. Net value: $30 + $10 – $40 = $0. Butterfly is worthless. You keep the full $1.70 credit. Profit: $170 per contract.
Scenario B — FDA rejection, stock drops to $68: All calls expire worthless. Butterfly is worthless. You keep the full $1.70 credit. Profit: $170 per contract.
Scenario C — FDA delays decision, stock stays at $85: The $75 call is worth $10, the $85 calls are ATM with $1-2 of time value each, the $95 call is worthless. Butterfly is near maximum value ($8-9). Loss: $6.30-$7.30 per share ($630-$730 per contract).
The short butterfly spread is the right structure here because the binary outcome (approval or rejection) makes a large move likely, and the credit structure means you profit equally from either direction. The risk is the delay scenario — the stock sits still while time decay erodes the position.
Frequently Asked Questions
Is a short butterfly spread bullish or bearish?
Neither. The short butterfly spread is a volatility trade — it profits when the stock moves significantly in either direction. At entry, the position is approximately delta-neutral with no directional bias. As the stock moves, delta shifts in the direction of the move (positive gamma), but the initial thesis is purely about magnitude of movement, not direction.
What is the maximum loss on a short butterfly spread?
The maximum loss equals the wing width minus the credit received. On a $10-wide short butterfly that collected $1.70 in credit, the maximum loss is $8.30 per share ($830 per contract). This occurs when the stock finishes exactly at the centre strike at expiration — the worst-case scenario where the body is at maximum value and the wings provide no offset.
Why would you sell a butterfly spread instead of buying one?
You sell a butterfly when you expect the stock to move away from the current price, not stay near it. The long butterfly profits from stillness; the short butterfly profits from movement. Selling a butterfly before earnings, FDA decisions, or other catalysts is a way to bet on a large move with defined risk and without paying the full cost of a straddle.
How does a short butterfly spread differ from a long straddle?
Both profit from stock movement, but the structures differ significantly. A long straddle has unlimited profit potential and costs significant premium ($15-$20 on a $550 stock). A short butterfly spread has capped profit (equal to the credit received, typically $1-$3) but requires little or no capital outlay. The straddle is better for very large moves; the short butterfly is better for moderate moves where the straddle’s breakevens are too far away.
Can you trade a short butterfly spread with puts instead of calls?
Yes. A short put butterfly uses the same structure with puts: sell 1 lower-strike put, buy 2 centre-strike puts, sell 1 upper-strike put. The payoff at expiration is identical to the short call butterfly at the same strikes. In practice, use whichever option type has tighter bid-ask spreads on the strikes you are trading. On most underlyings with balanced skew, the difference is negligible.
FATTAIL BRIEFINGS
Get FatTail briefings in your inbox
Pick the lists you want. FOMC Alerts is selected by default.